

Real-time analytical reporting and mapping to support command staff in strategic planning
InfoShare® Analytics and Crime Mapping module provides real-time CompStat analysis and reporting, an Ad Hoc search engine, crime mapping, and analytical capabilities with graph generation. This module helps agencies systematically collect data, identify emerging trends, and use the power of advanced analytics to implement data-driven crime prevention strategies.
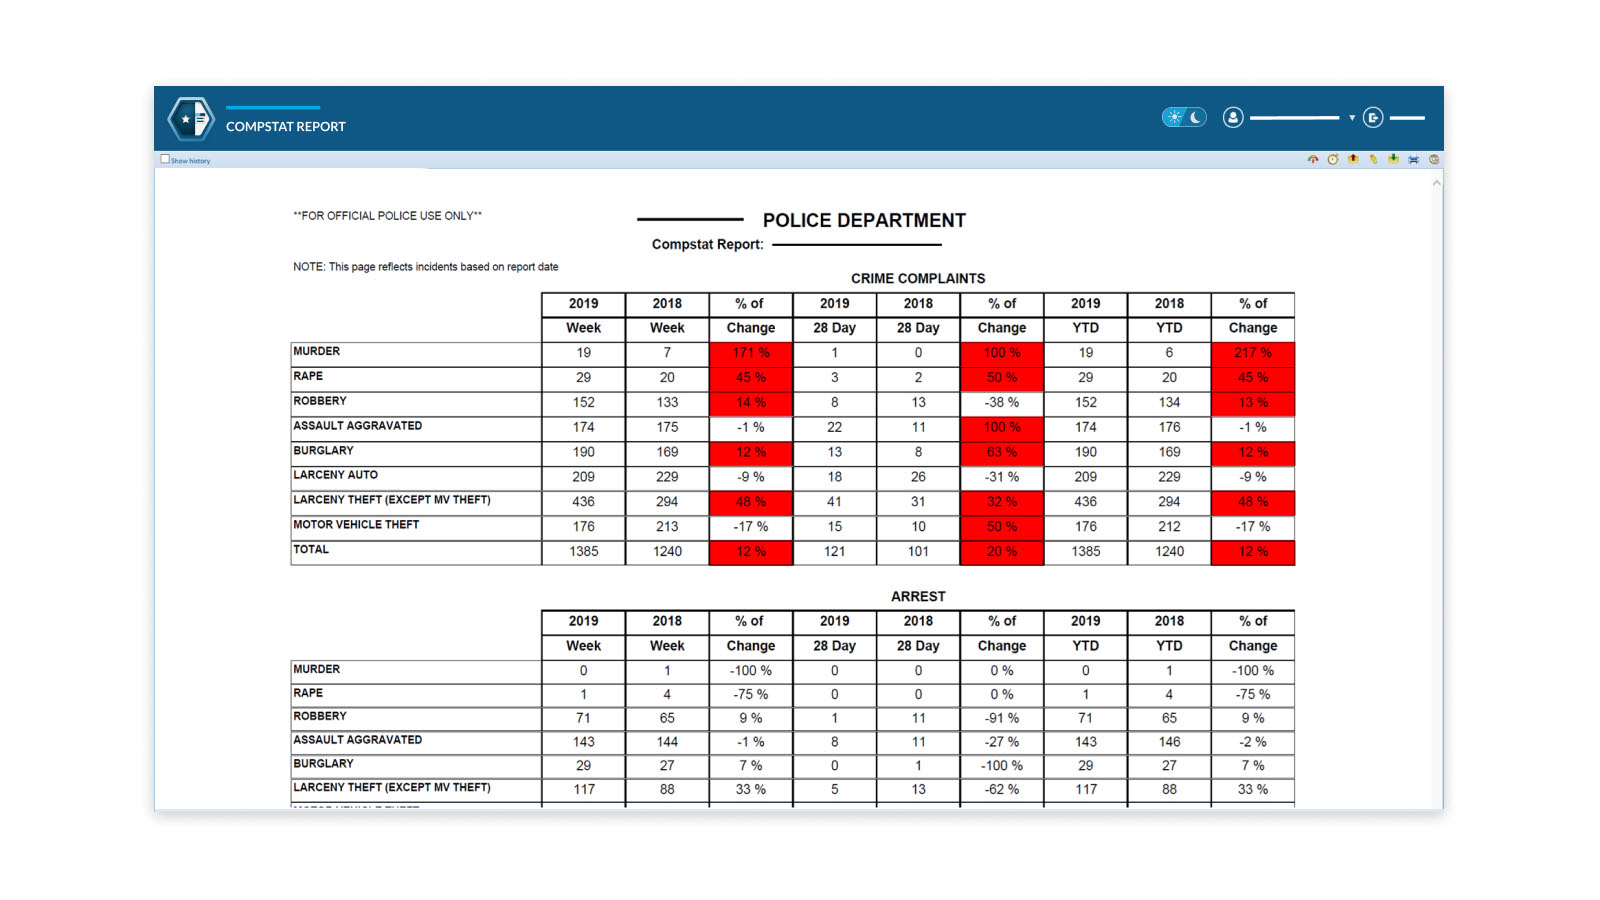
Auto-Generated CompStat Reporting
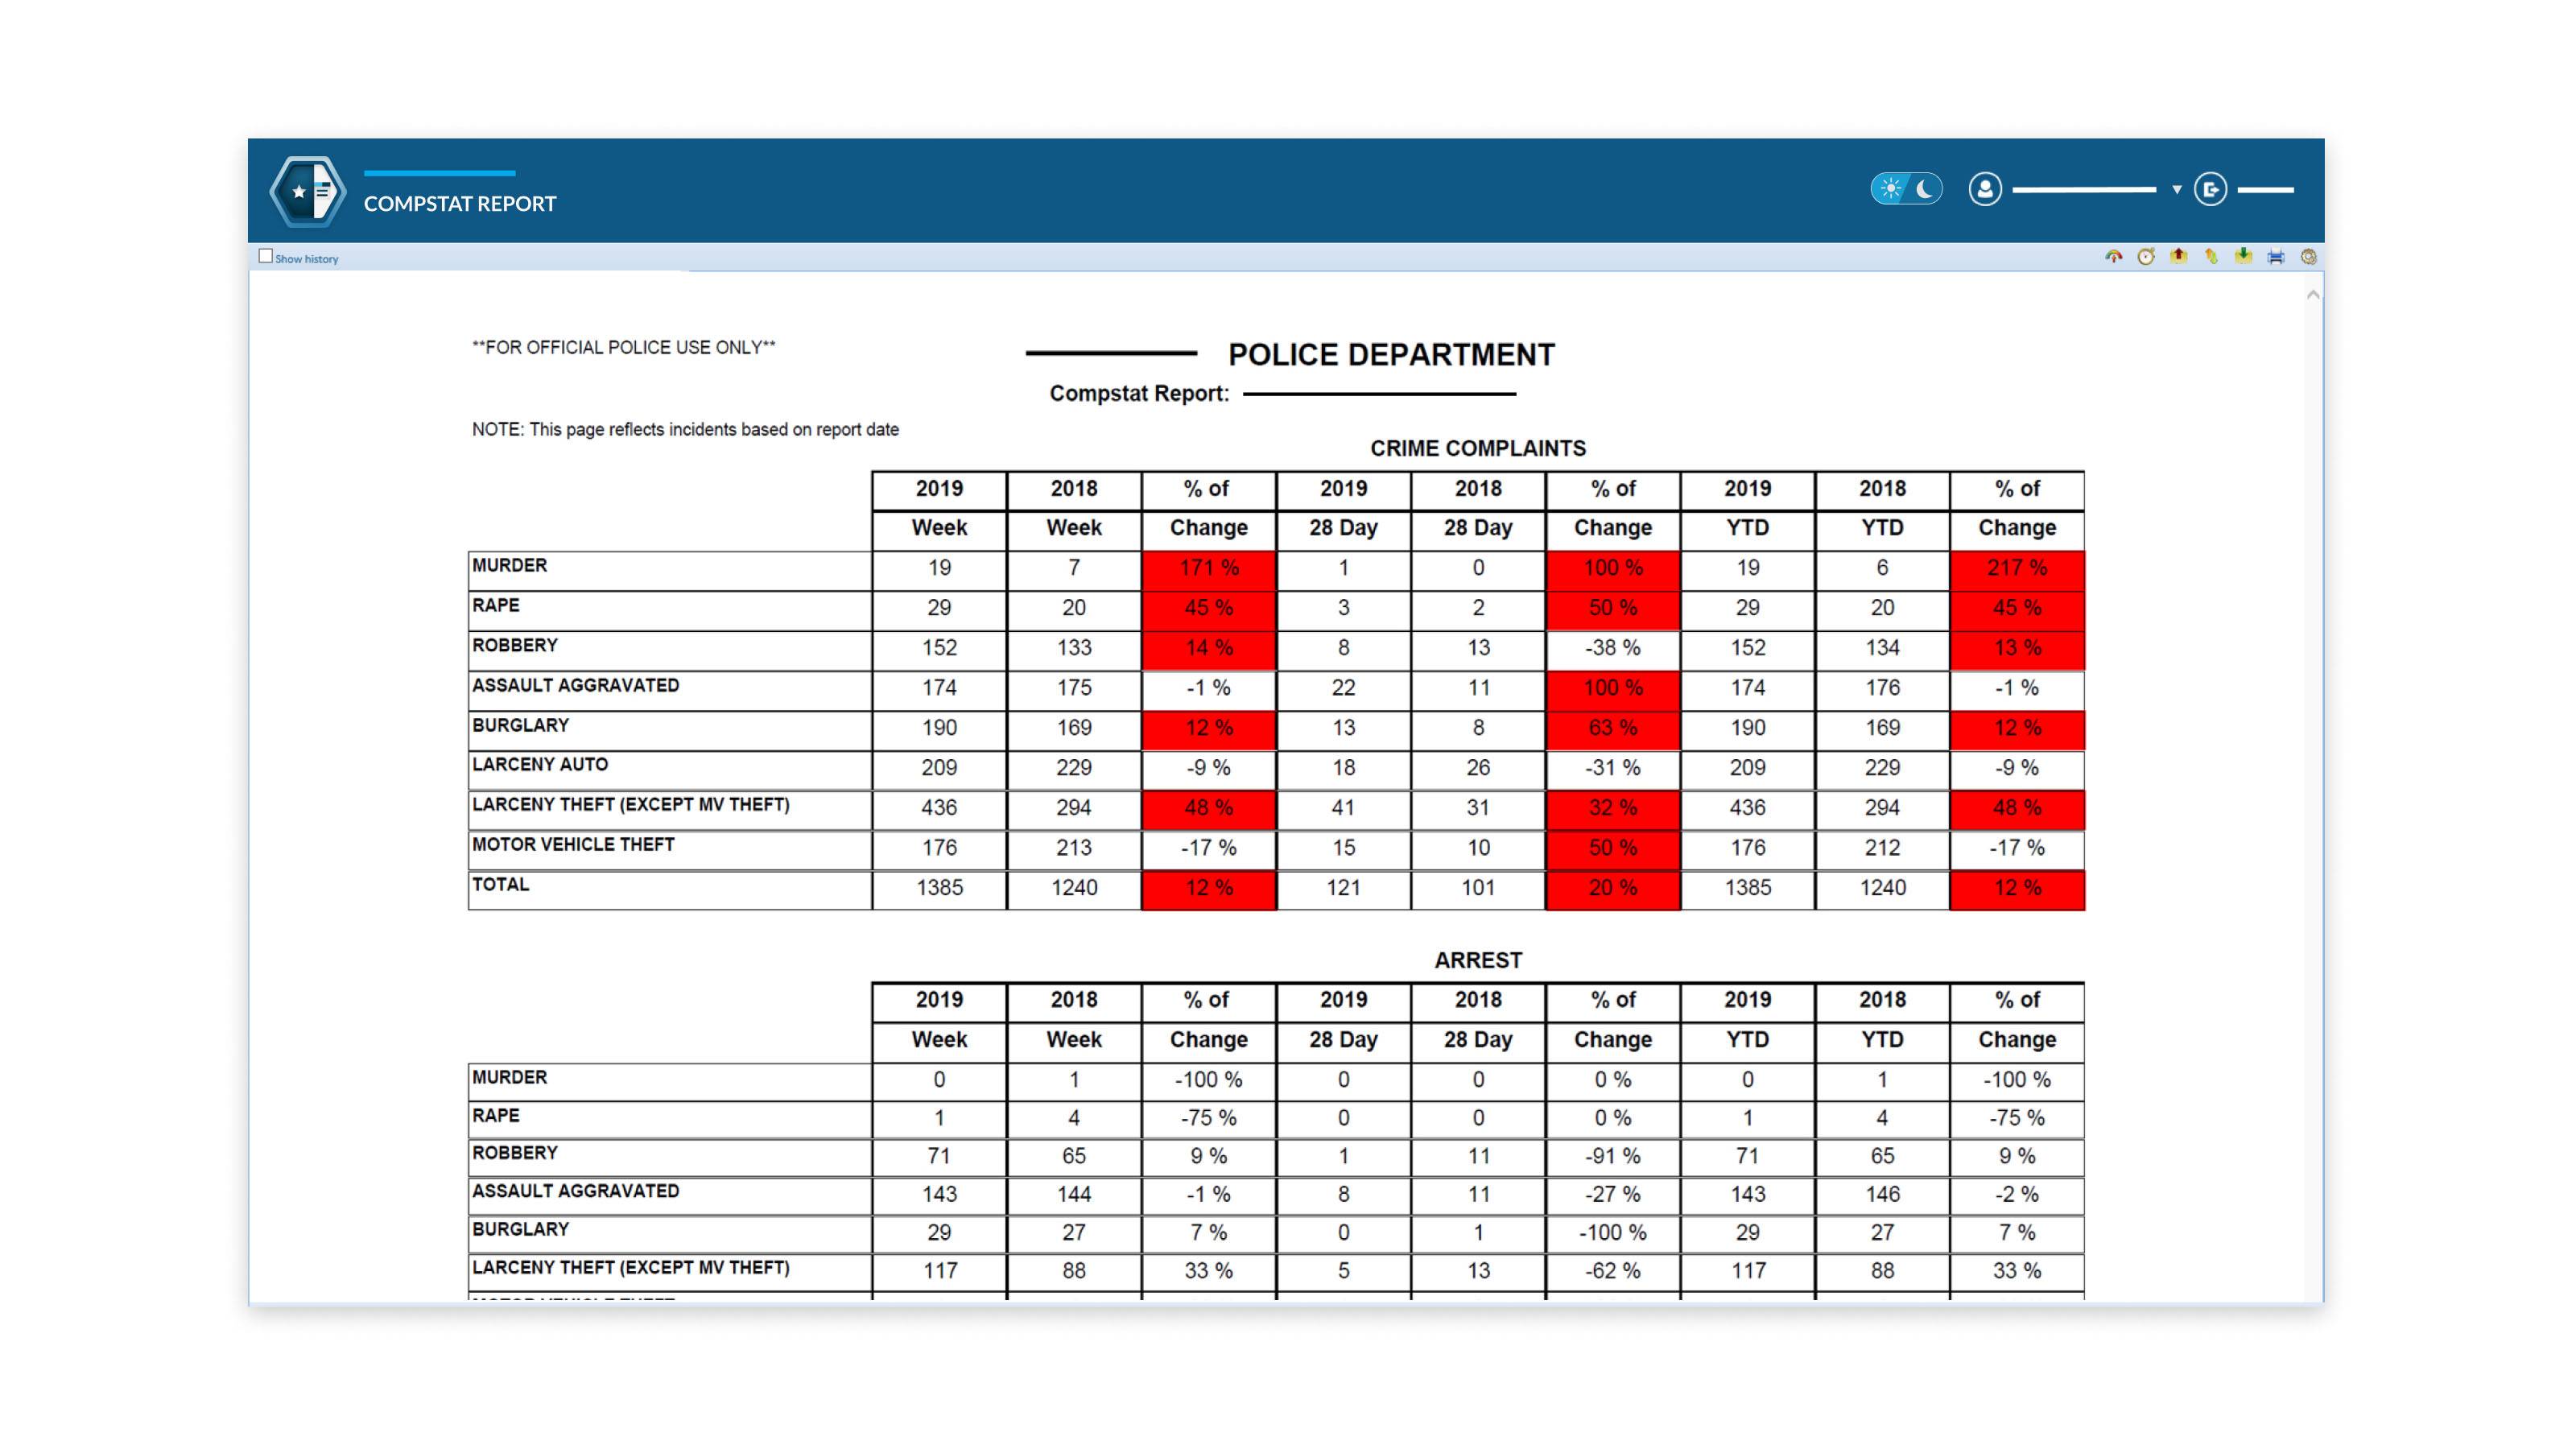
Systematically collect and analyze crime data for data-driven policing. All Ad Hoc and CompStat reports can be generated for a specific time period, detailing exactly the number of crimes, quality of life offenses, accidents, and traffic citations in a jurisdiction.
- Crime statistics comparison
- Percentage increase/decrease visualization
- Time period (hour, day, week, month, year)
- Arrests against Crimes comparison
- Reporting by agency, district, sector or post
Exclusive Ad Hoc Search Engine
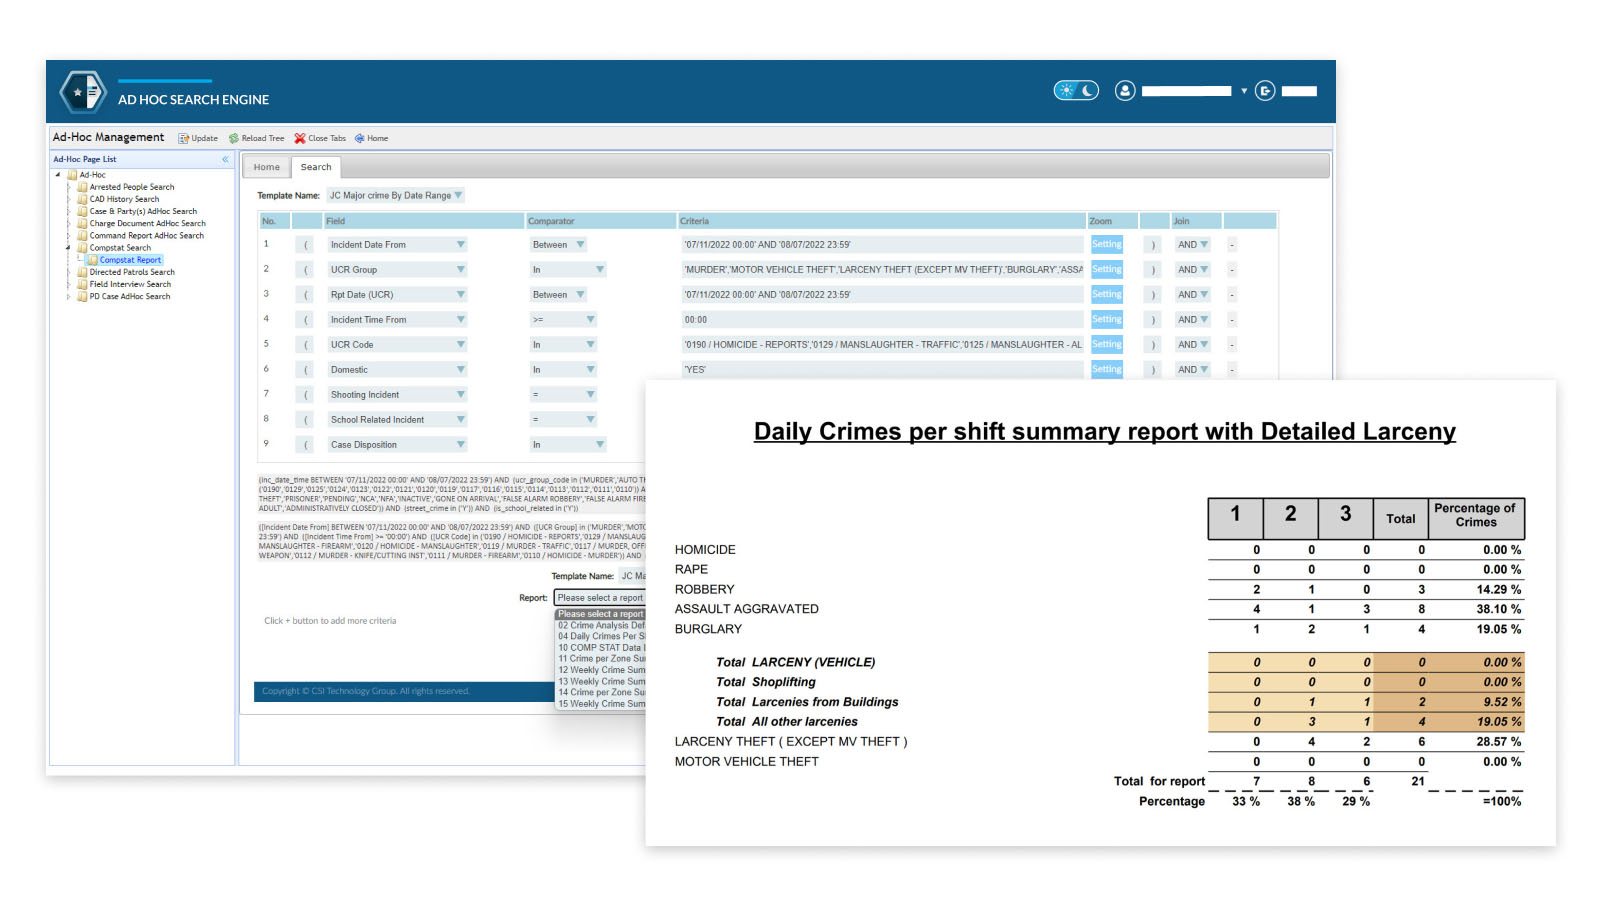
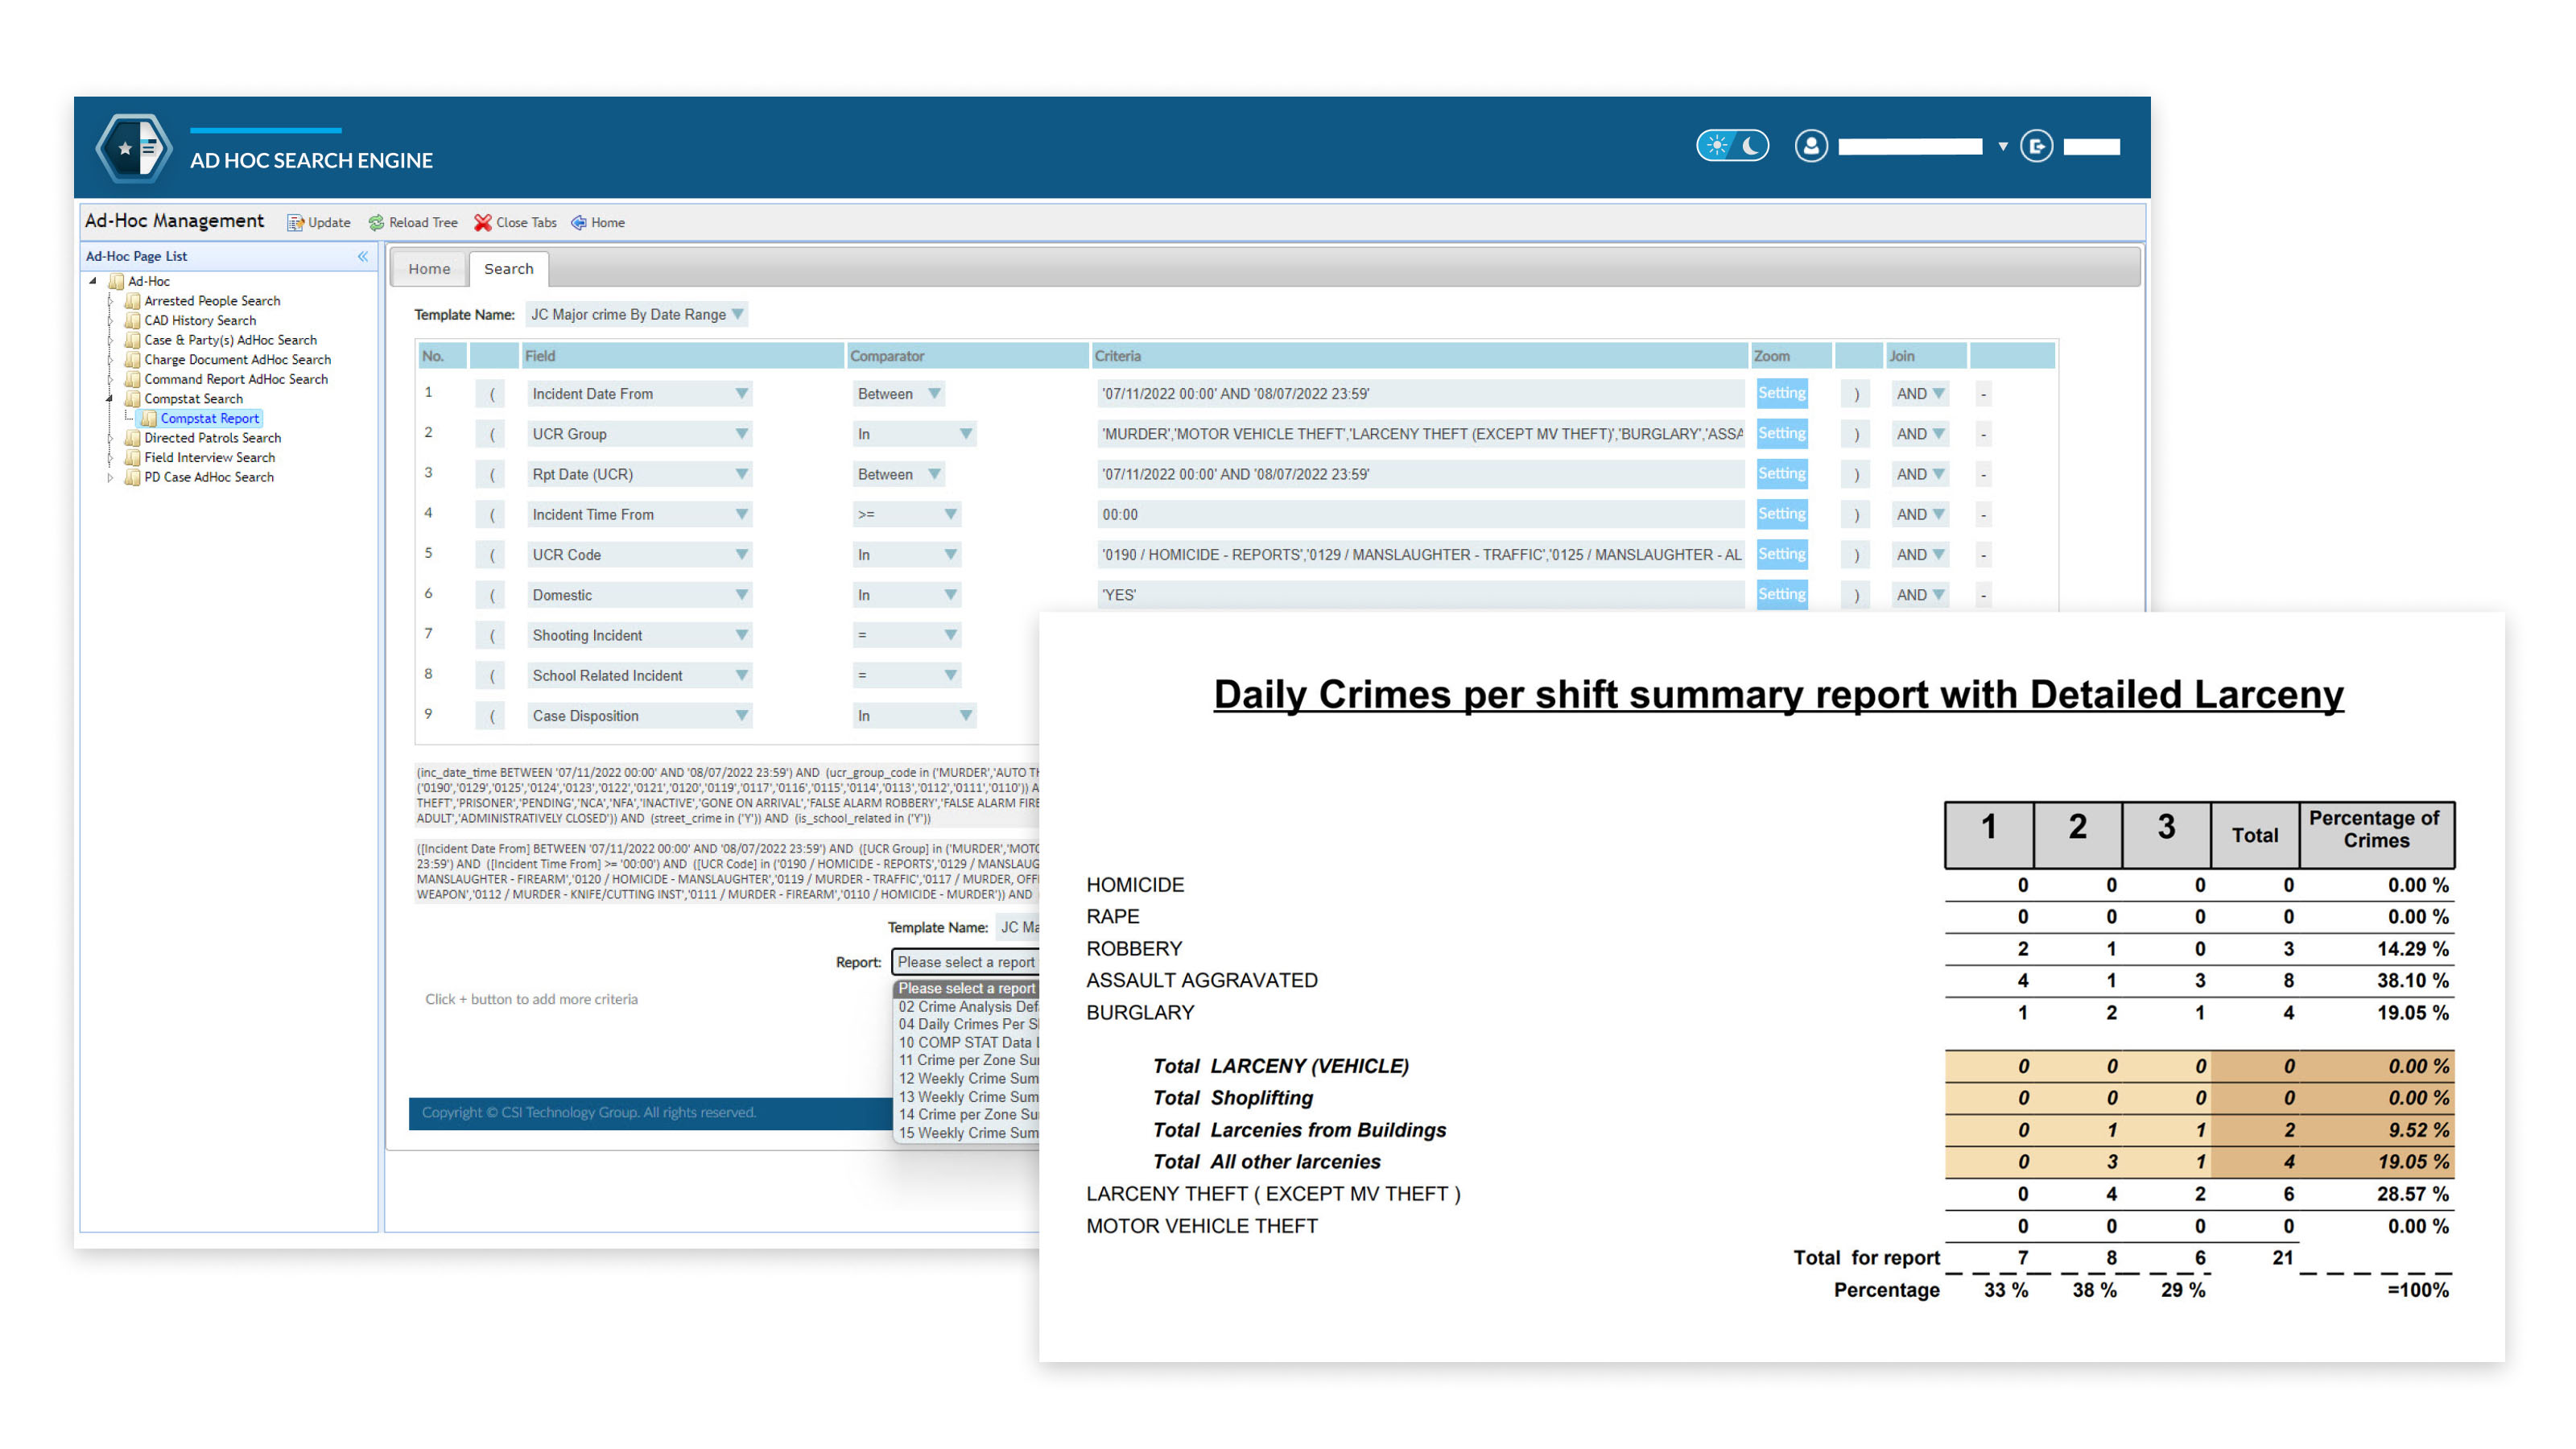
Deliver comprehensive statistics and analytical reports without having to run multiple queries in different databases. Simply enter the search criteria, and the relevant information can be parsed out into countless reports and formats with a click of a button.
- Reusable template generation
- Crime type search
- Arrested people search
- CAD history search
- Directed patrol search
Next-level Crime Mapping
Visualize criminal activity patterns, identify crime hot spots, and deploy proactive policing efforts. Drill down on individual incidents and easily access any linked reports. Configurable search features ensure users find the needed data as quickly as possible.
- Multidimensional incident analysis
- Hot spot and heat mapping
- Incident clustering
- Quality of life complaints
- Polygon map search
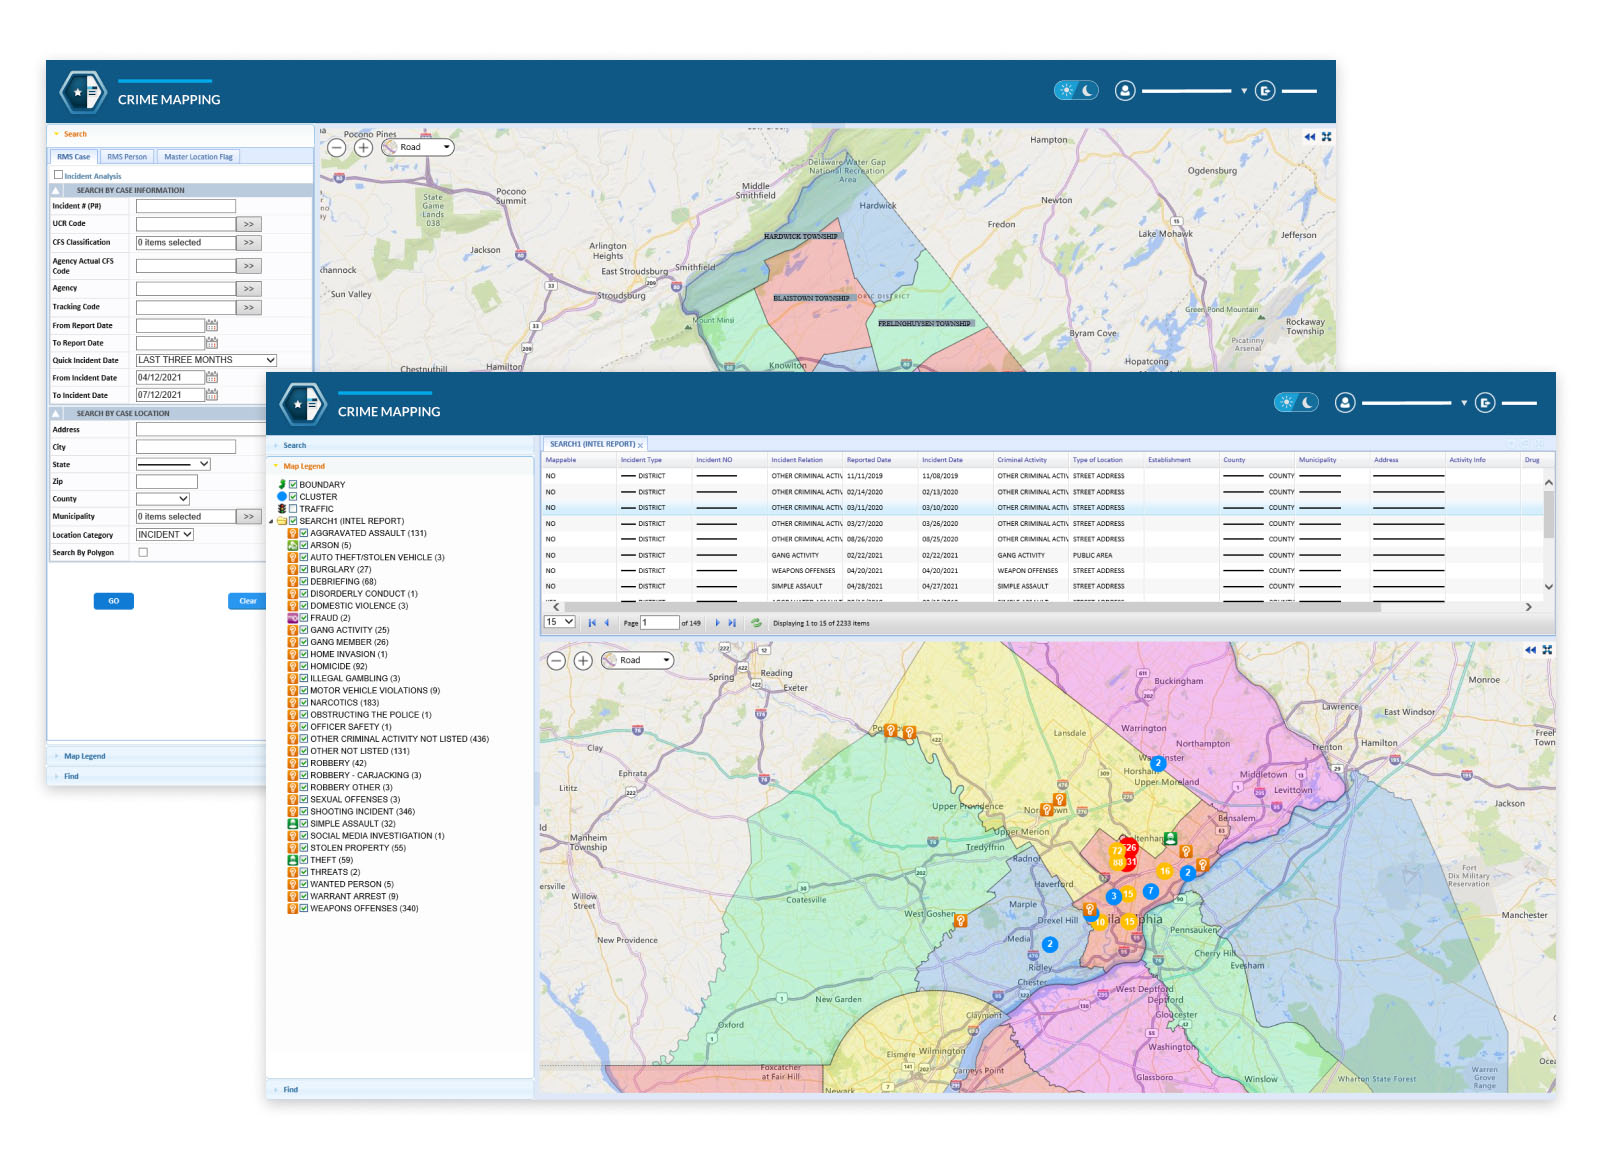
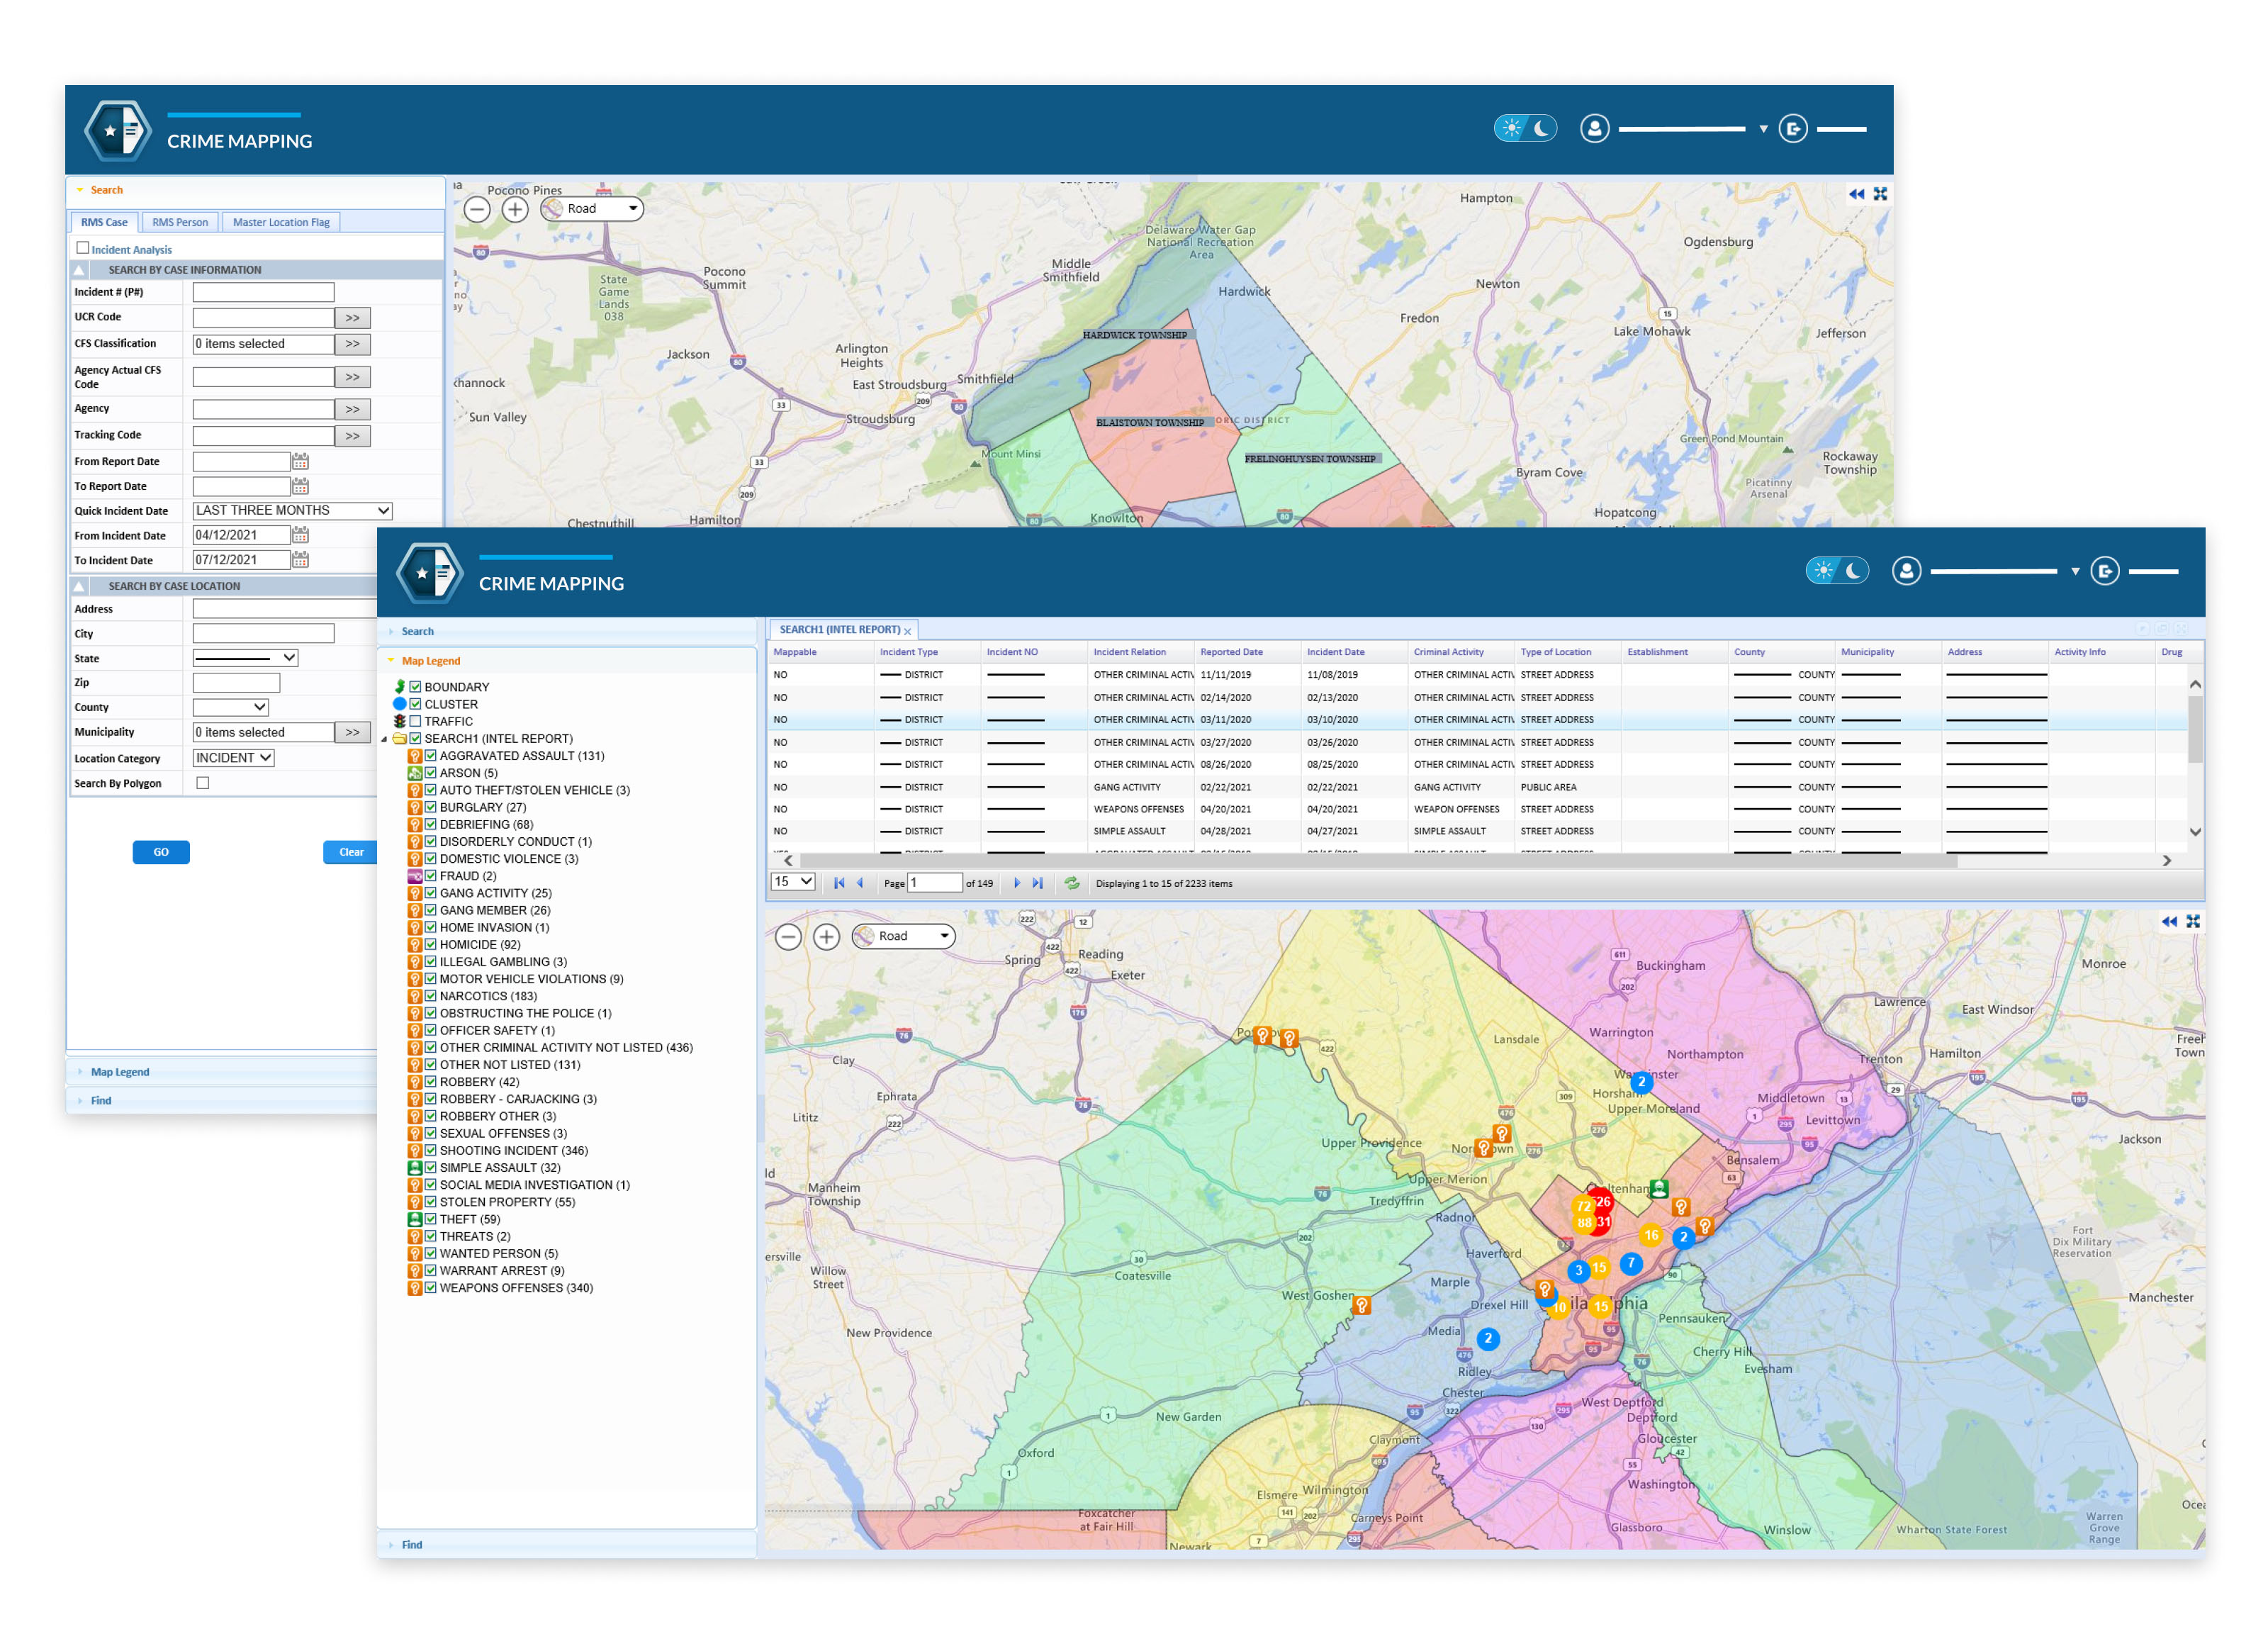
Chart and Graph Generation
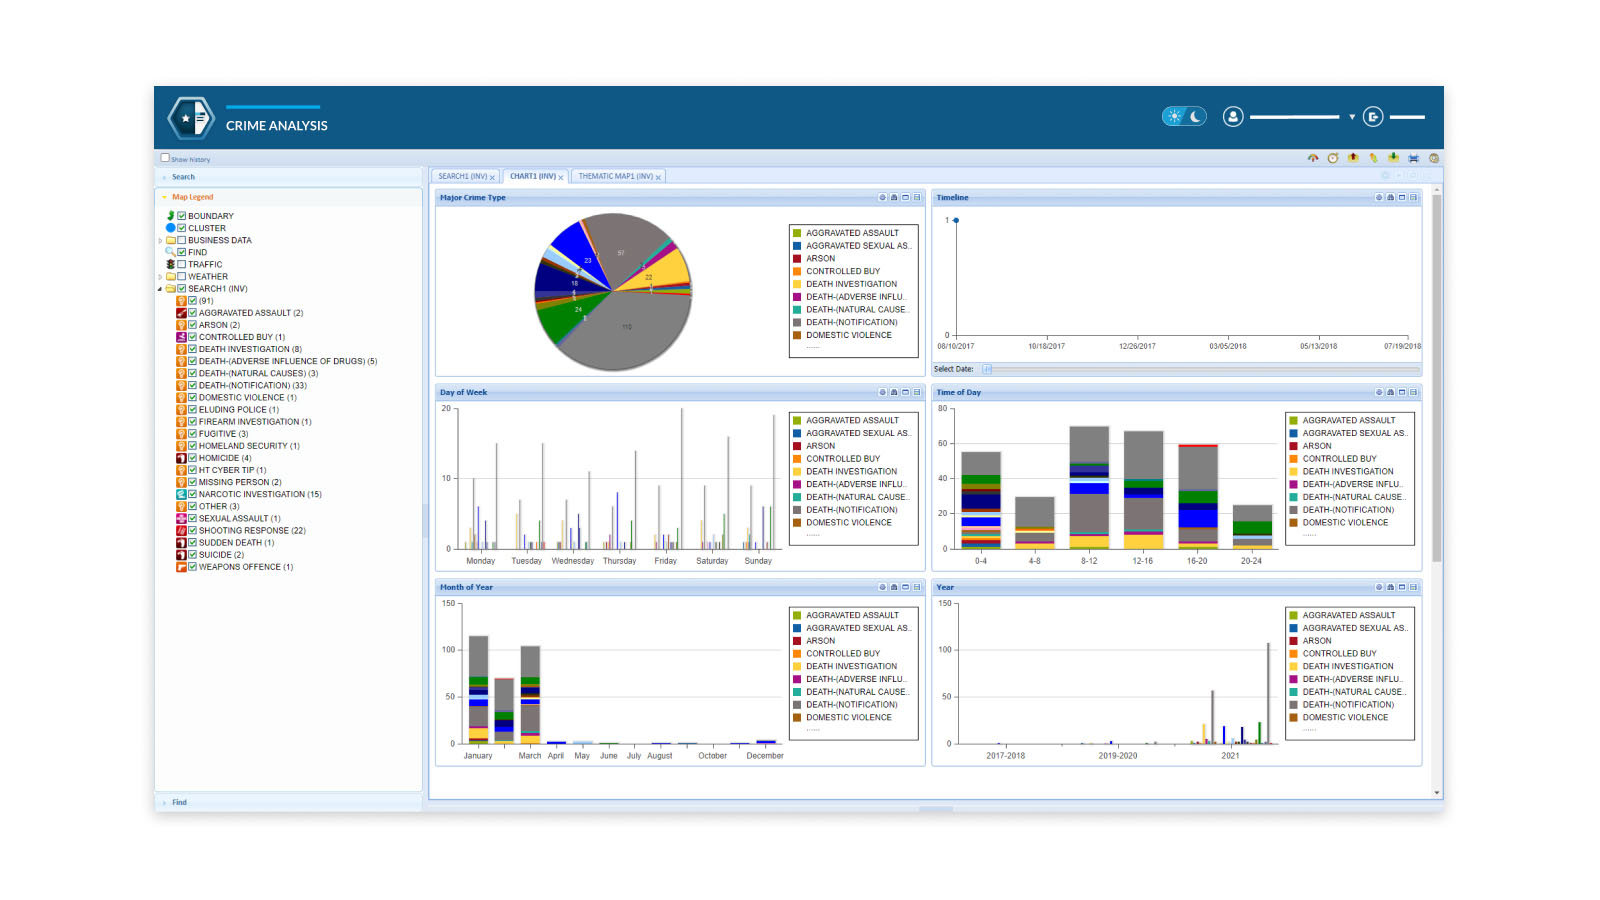
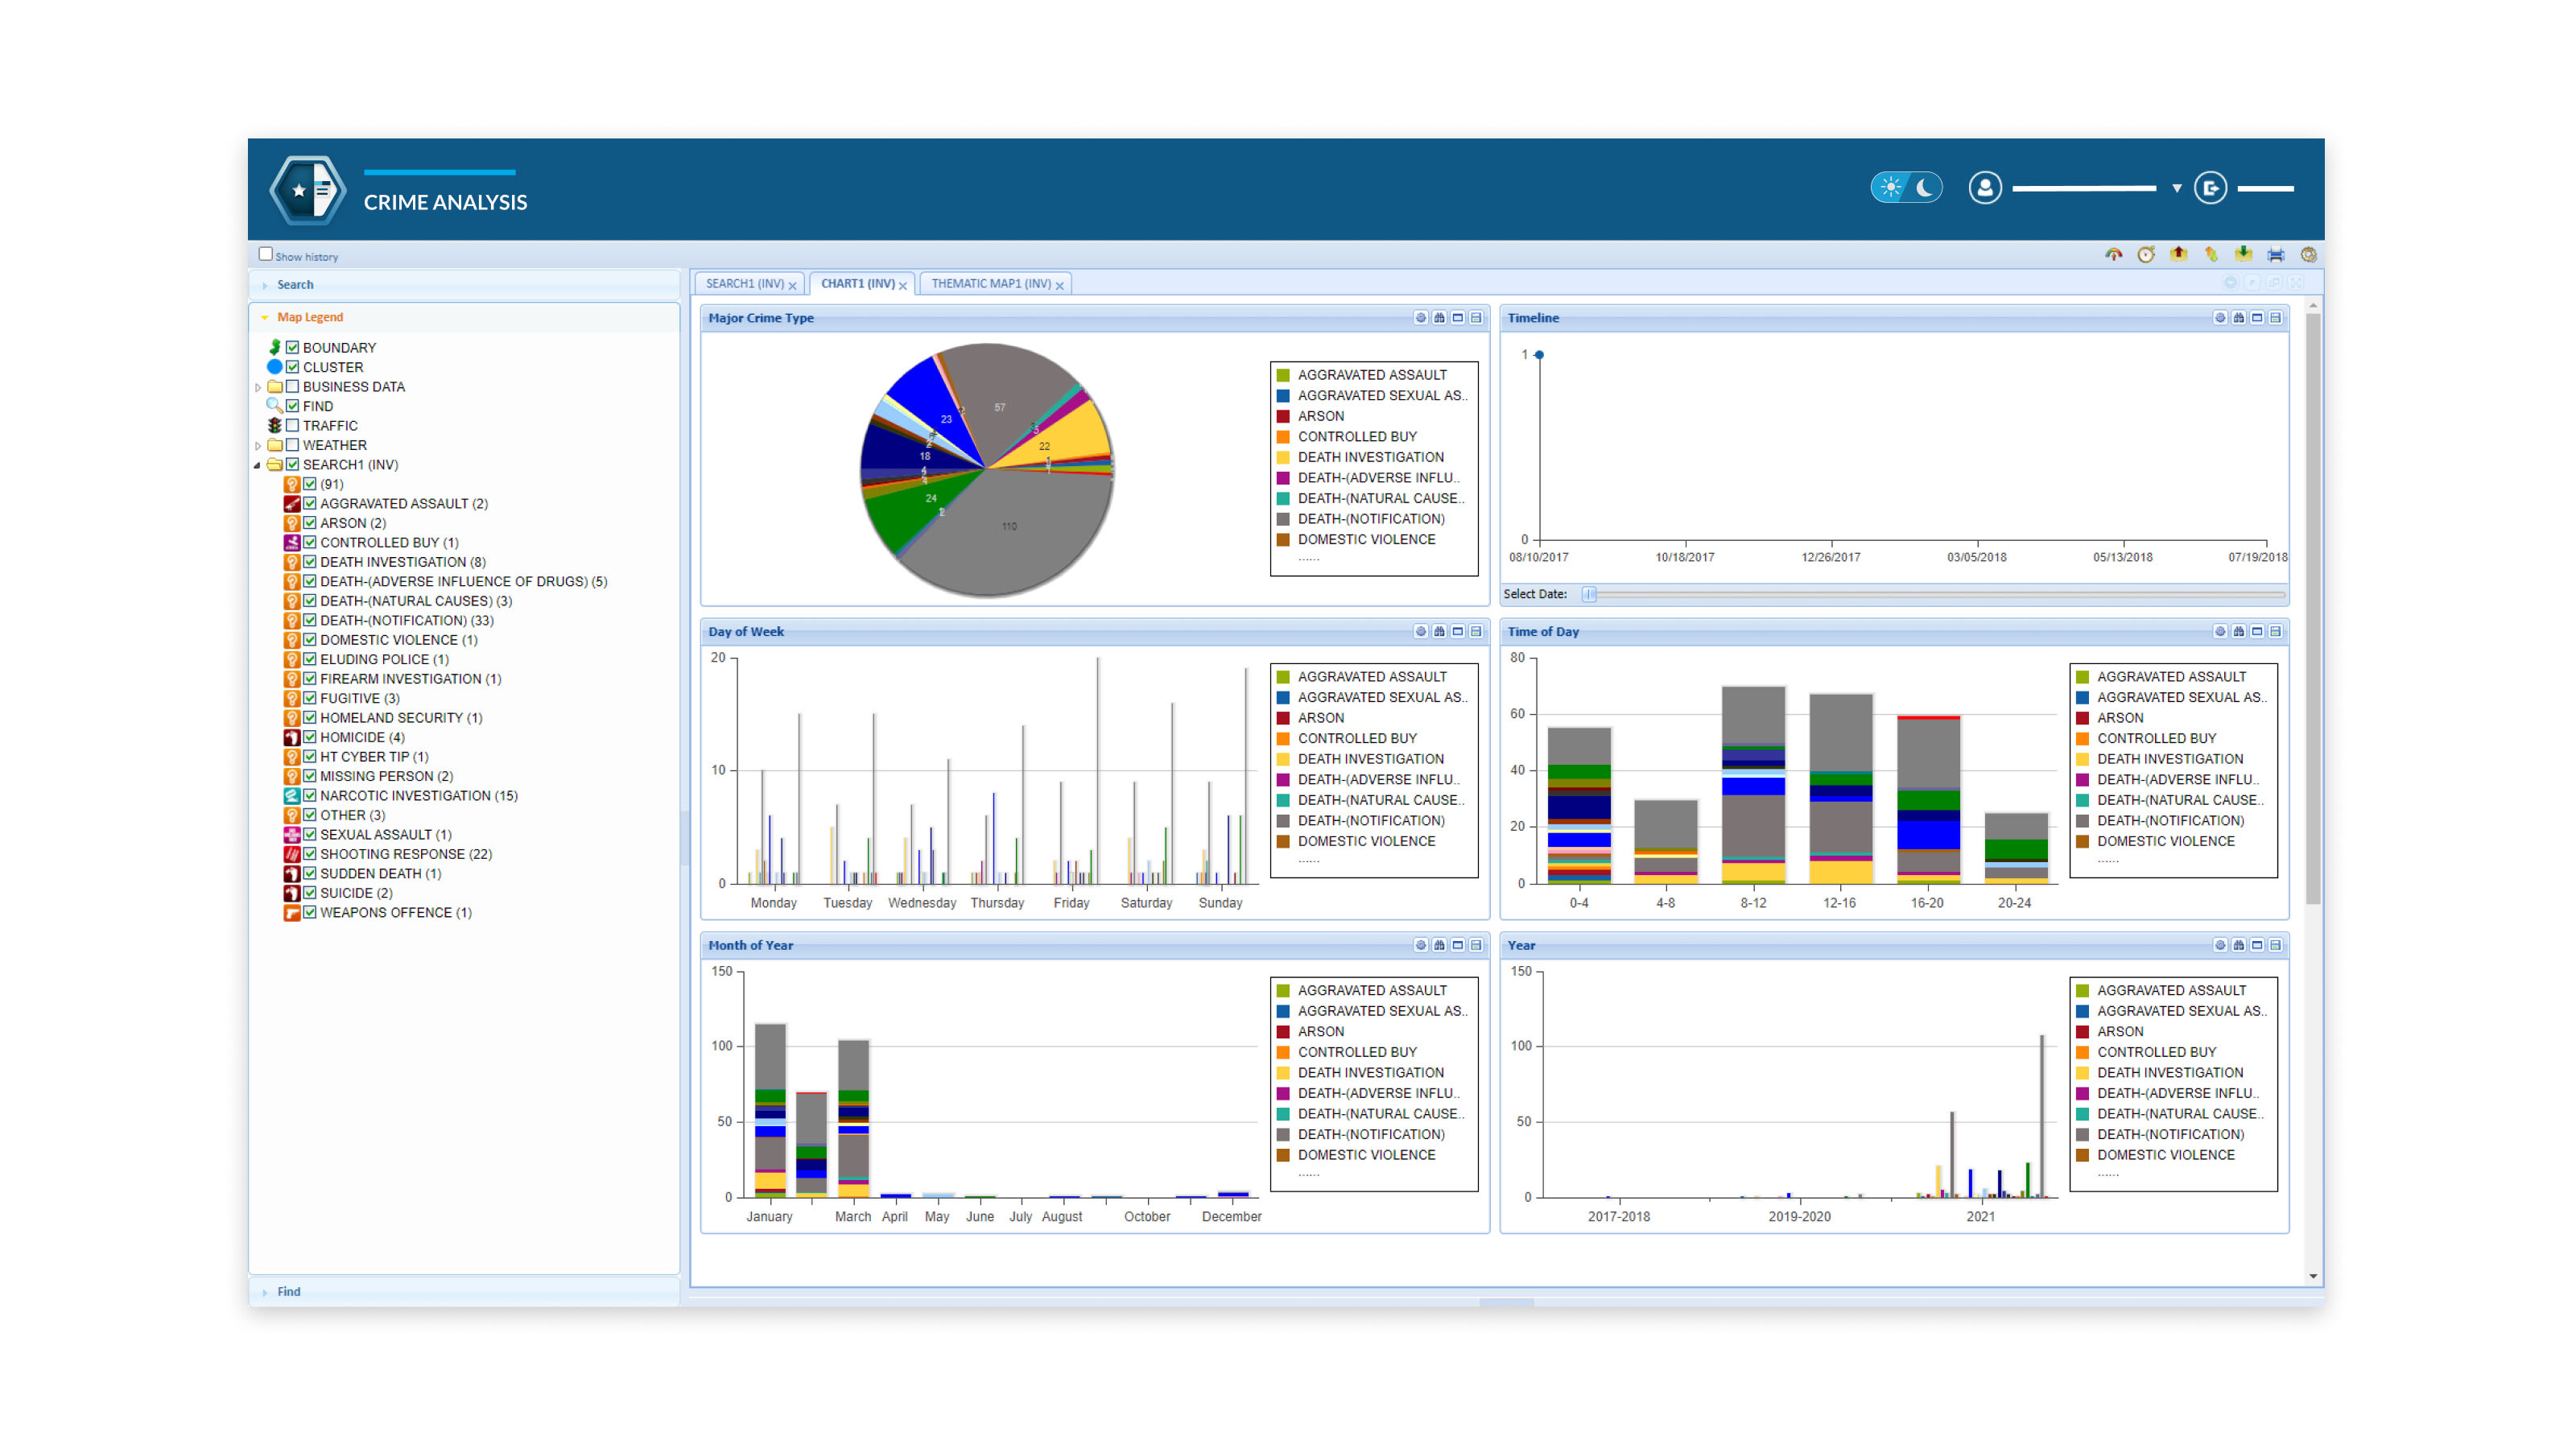
Generate a wide variety of charts and graphs to create a comprehensive picture of crime. Charts and graphs display complex data in a simple format, allowing agencies to visualize relationships, trends, and patterns of criminal activity and uncover investigative insights.
- CFS classification & crime type
- Timeline of crime data
- Time (day, day of week, month, year)
- Multi-tab display

Peter Ugalde
Director - CAD/RMS Division


Always focus on developing others


Thomas H. Koundry
Deputy Director – CAD/RMS Division
Related Articles
 Success Stories
Delaware County’s Unified Approach to Records Management and Prosecution Using InfoShare®
 Success Stories
Strengthening the North Country: How InfoShare® CAD/RMS Transformed the New London Dispatch Center Two Years Later
 News
InfoShare® Global Search and the Next Generation of Law Enforcement Data Sharing
 Success Stories