

Visualize data to reveal relationships, trends, and patterns of criminal activity
Leverage advanced data collection and analytics to transform vast amounts of stored data into meaningful and insightful information, revealing crime trends and hidden patterns. Visualize data to draw connections to and between crimes, people, places, and vehicles. Analytics help agencies make better decisions, allocate resources more efficiently, and provide intelligence-led policing.
Intelligence Dashboard
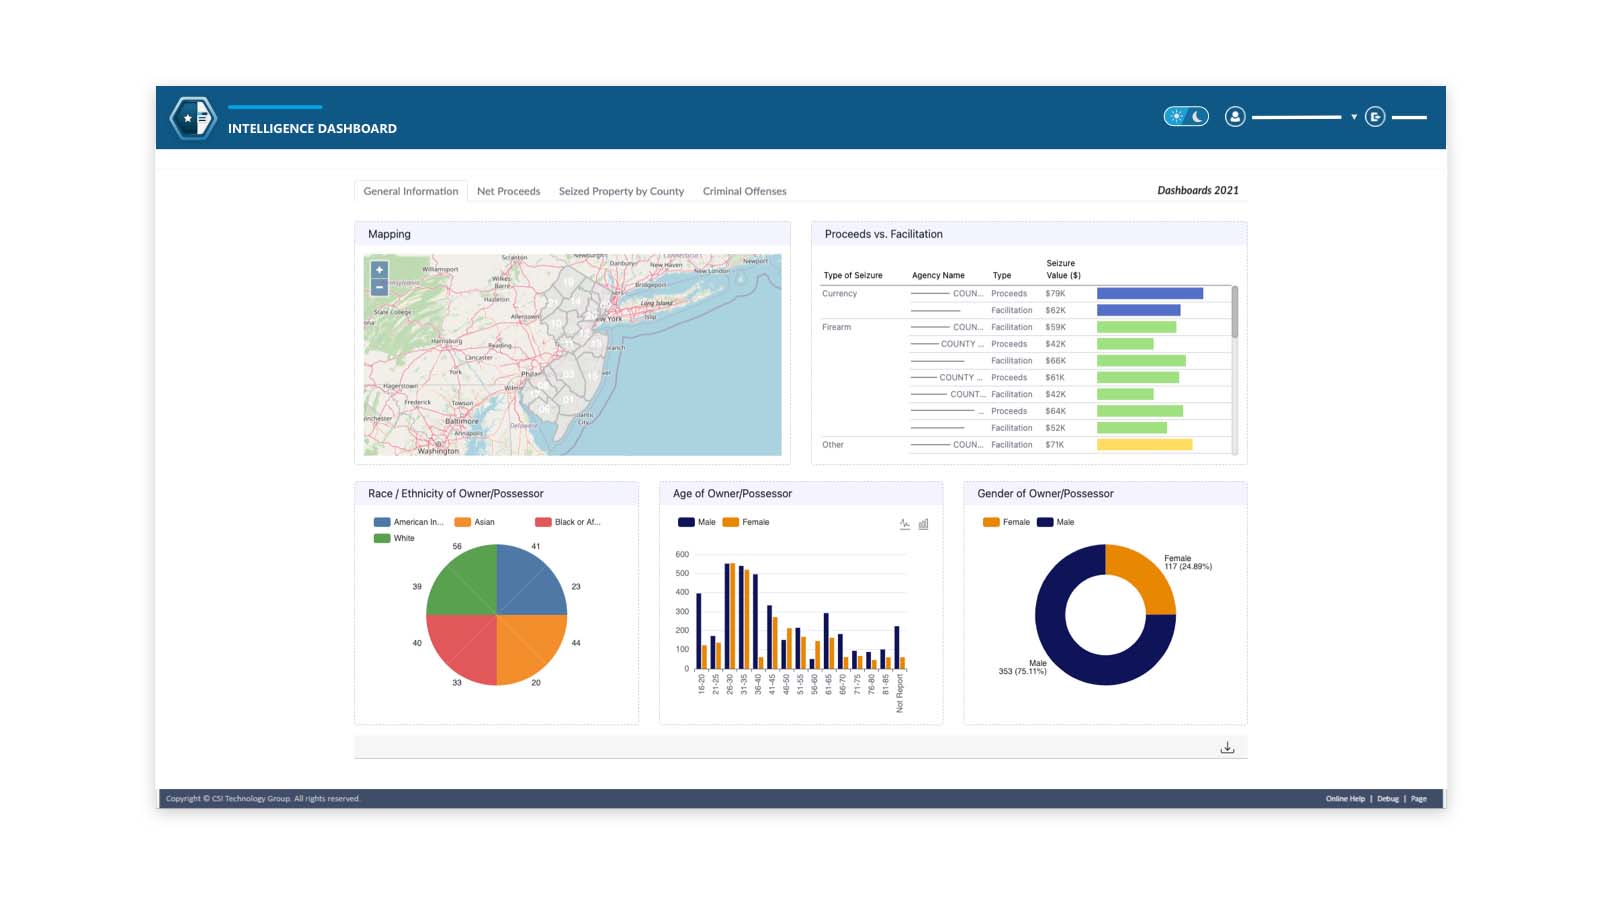
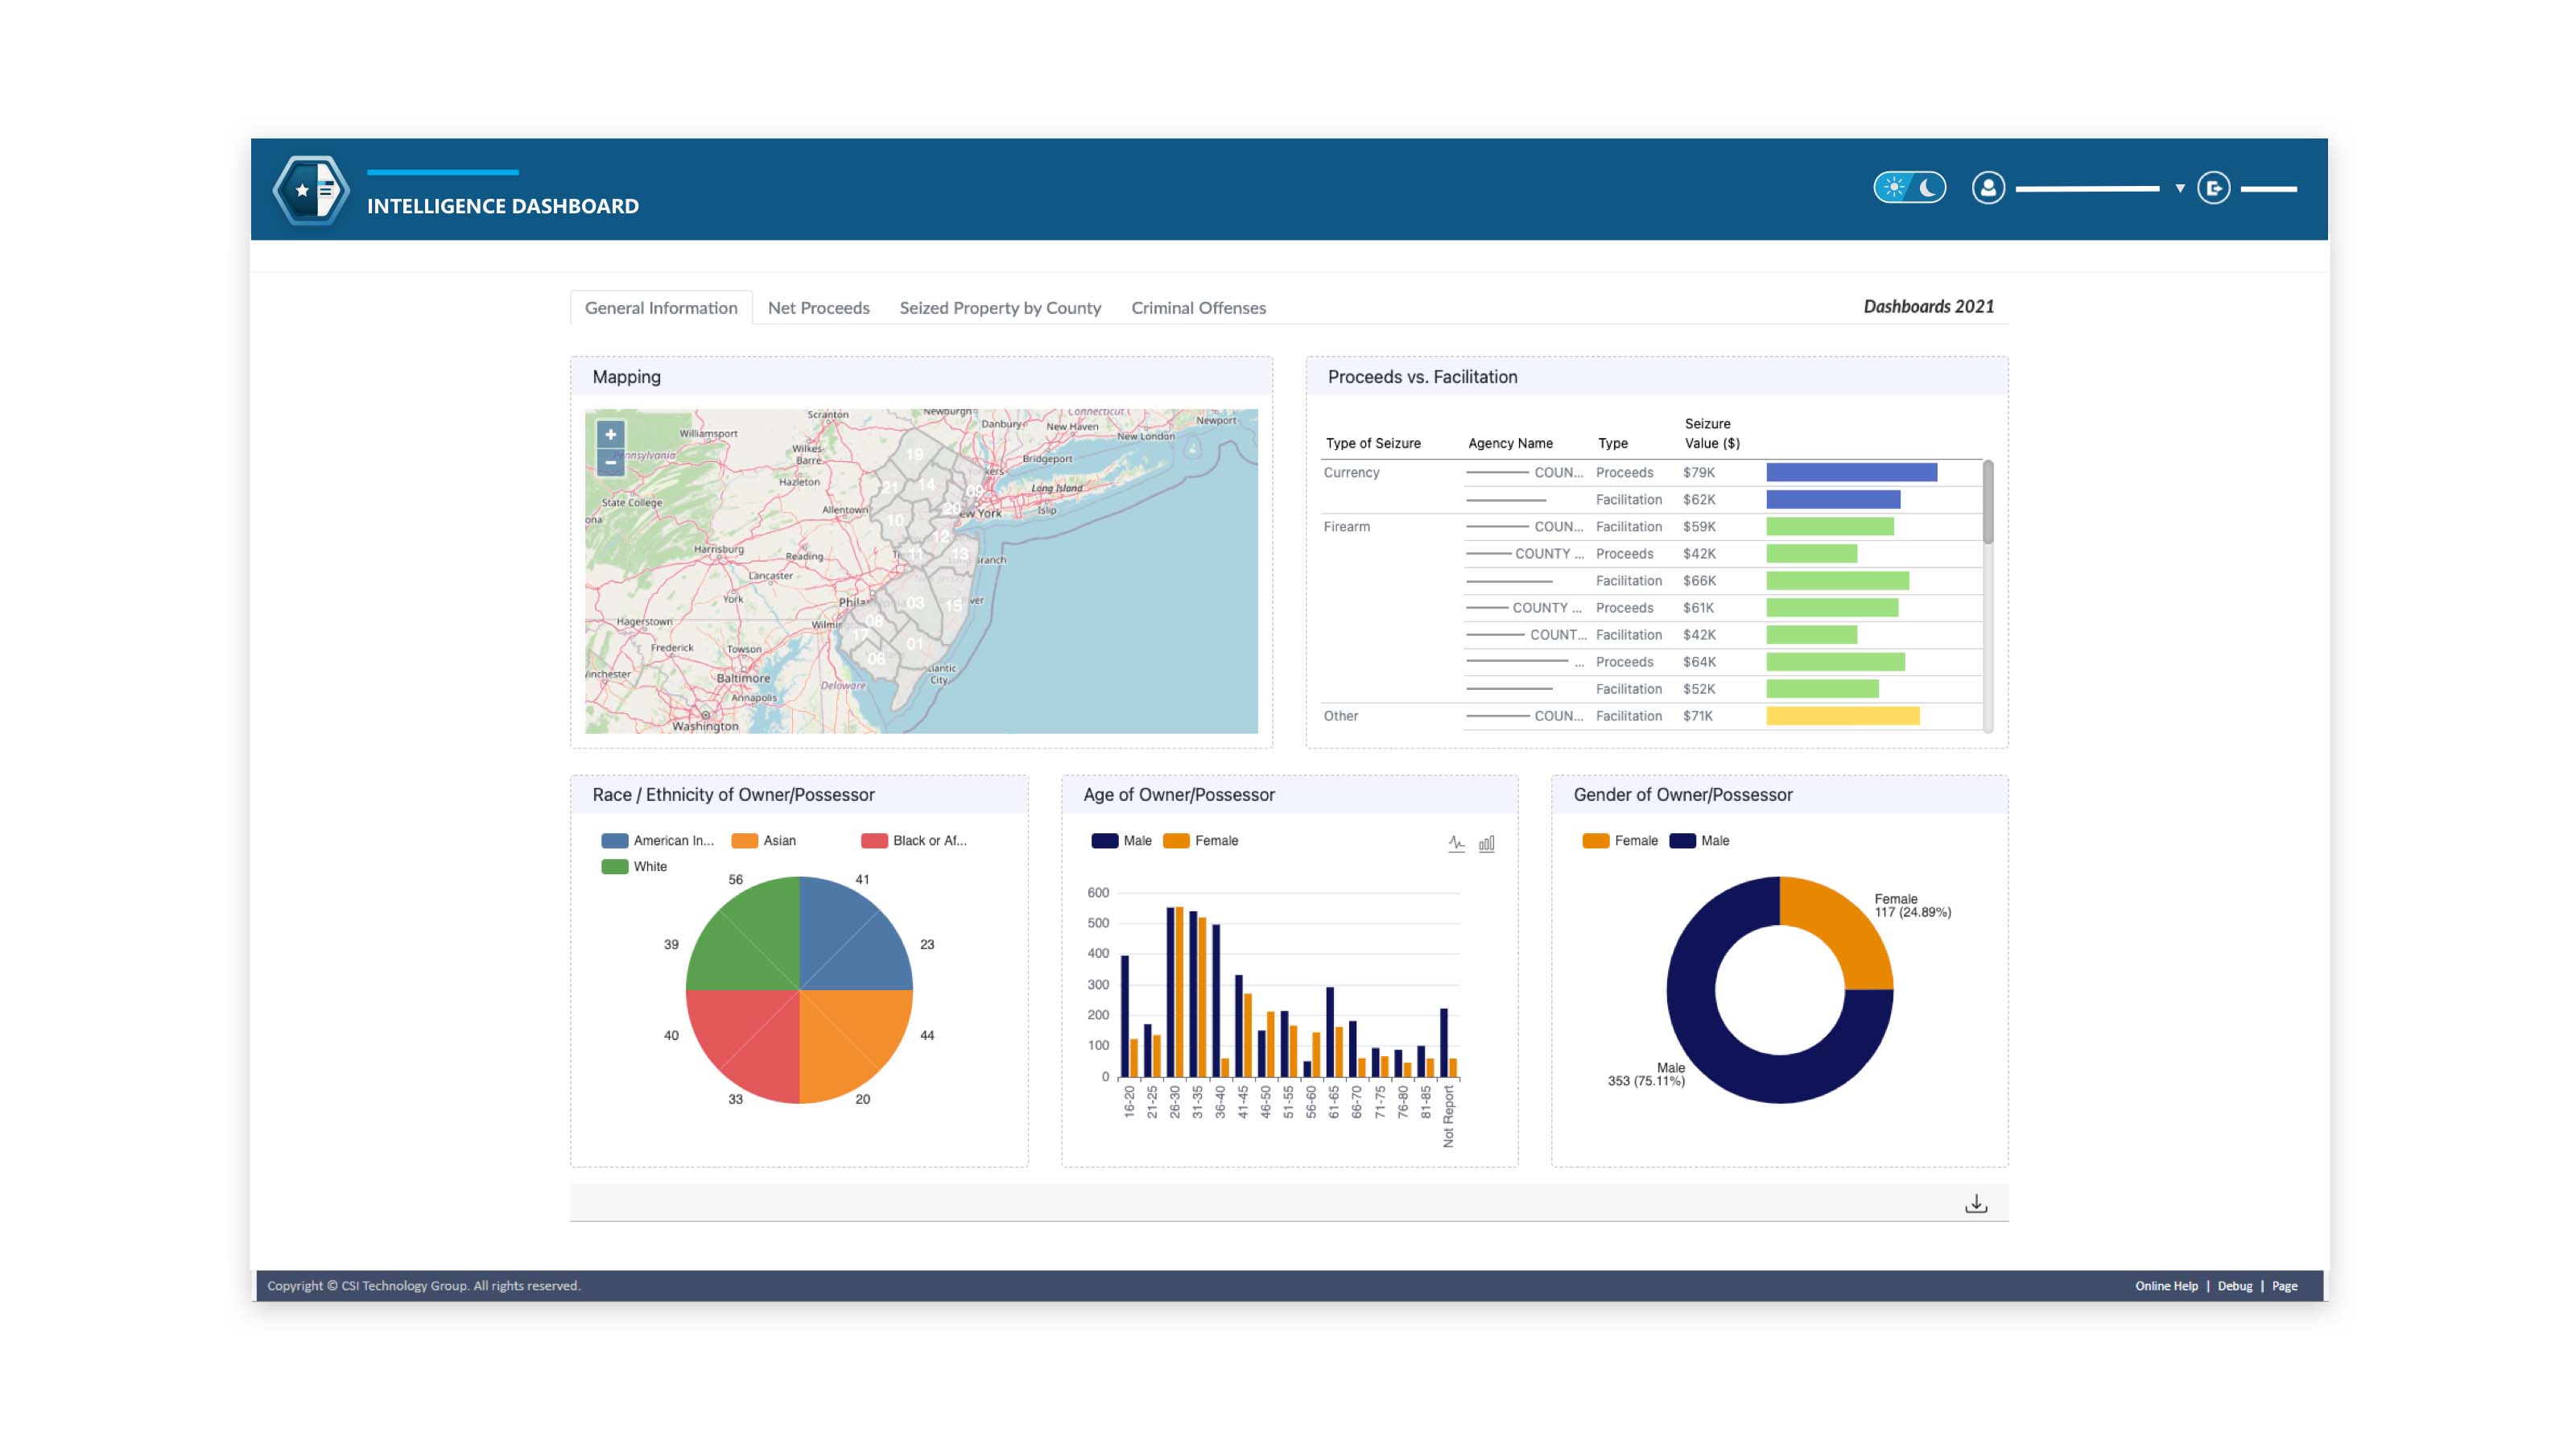
Provide a visual snapshot of selected data including intelligence reports, analytics, and interactive graphs, configured to user preferences. Each segment can be expanded and explored in detail. Administratively, view which members are creating report and identify approved reports by week.
- Configurable display of reports and analytics
- Multiple datasets and graphs displayed in one window
- Interactive graph of new reports
- Expandable segments
- Multi-tab analytics data grouping
Visual Links
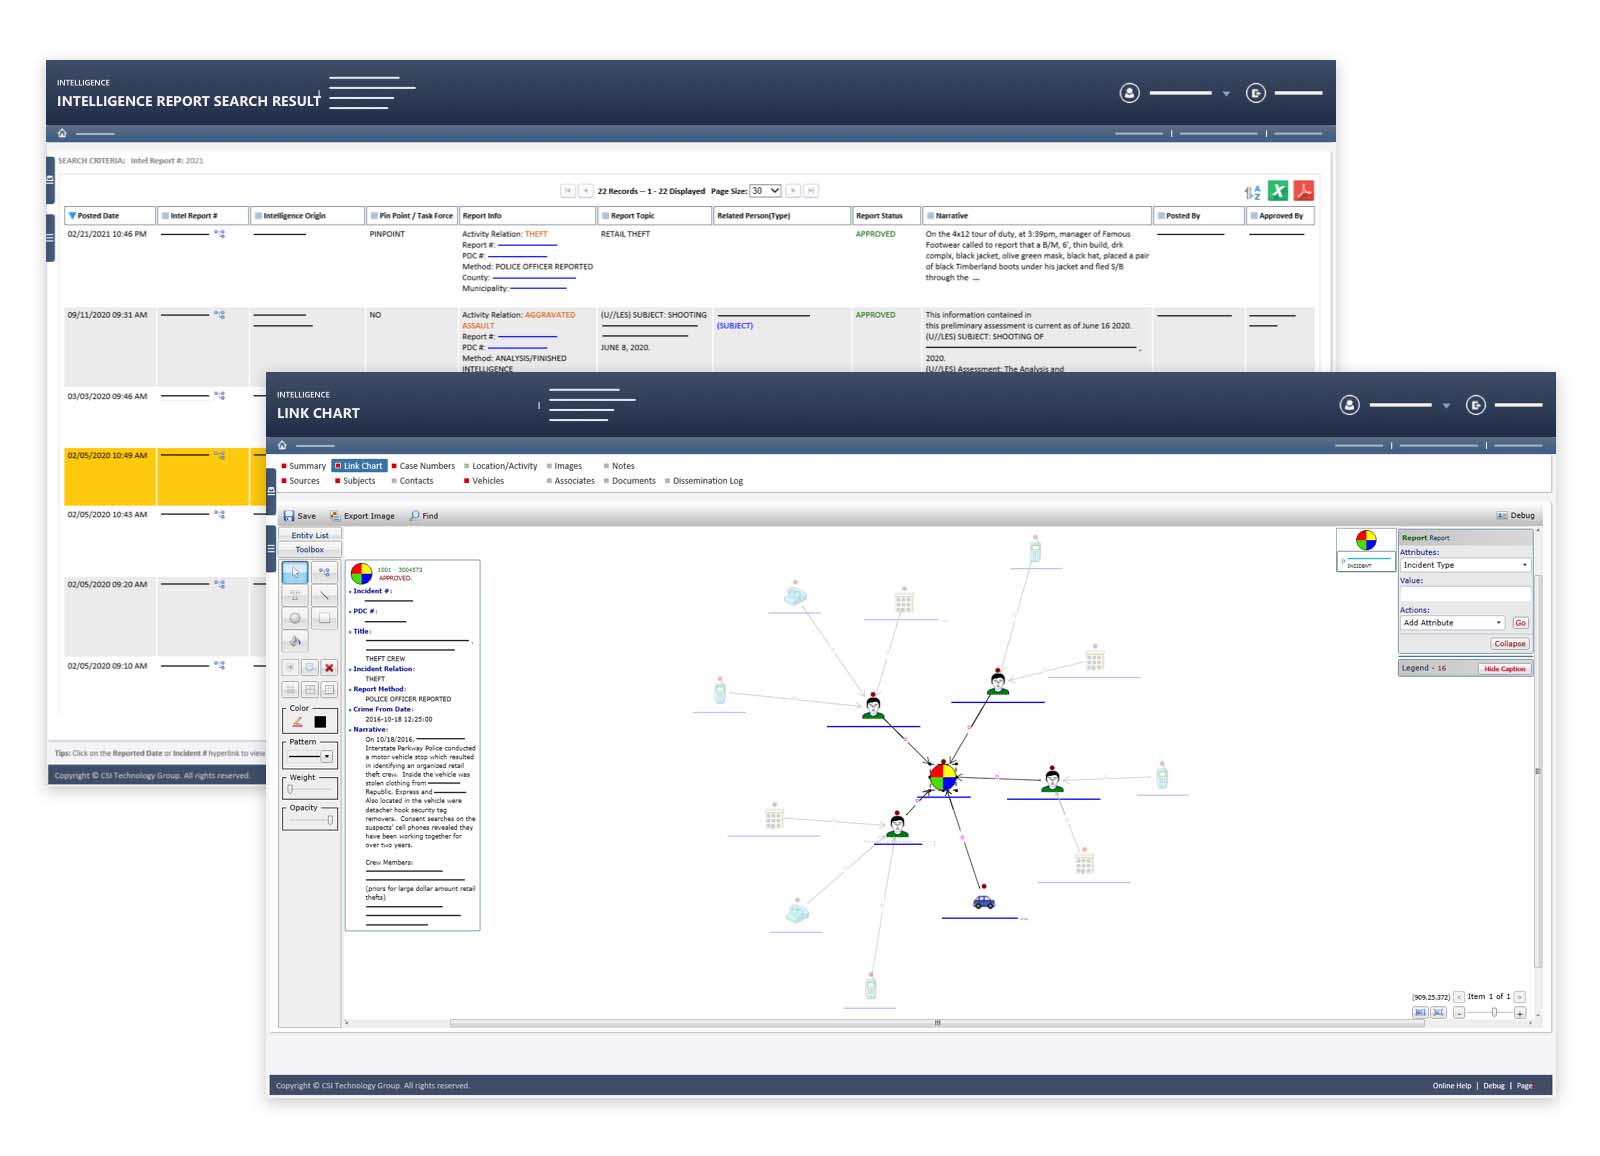
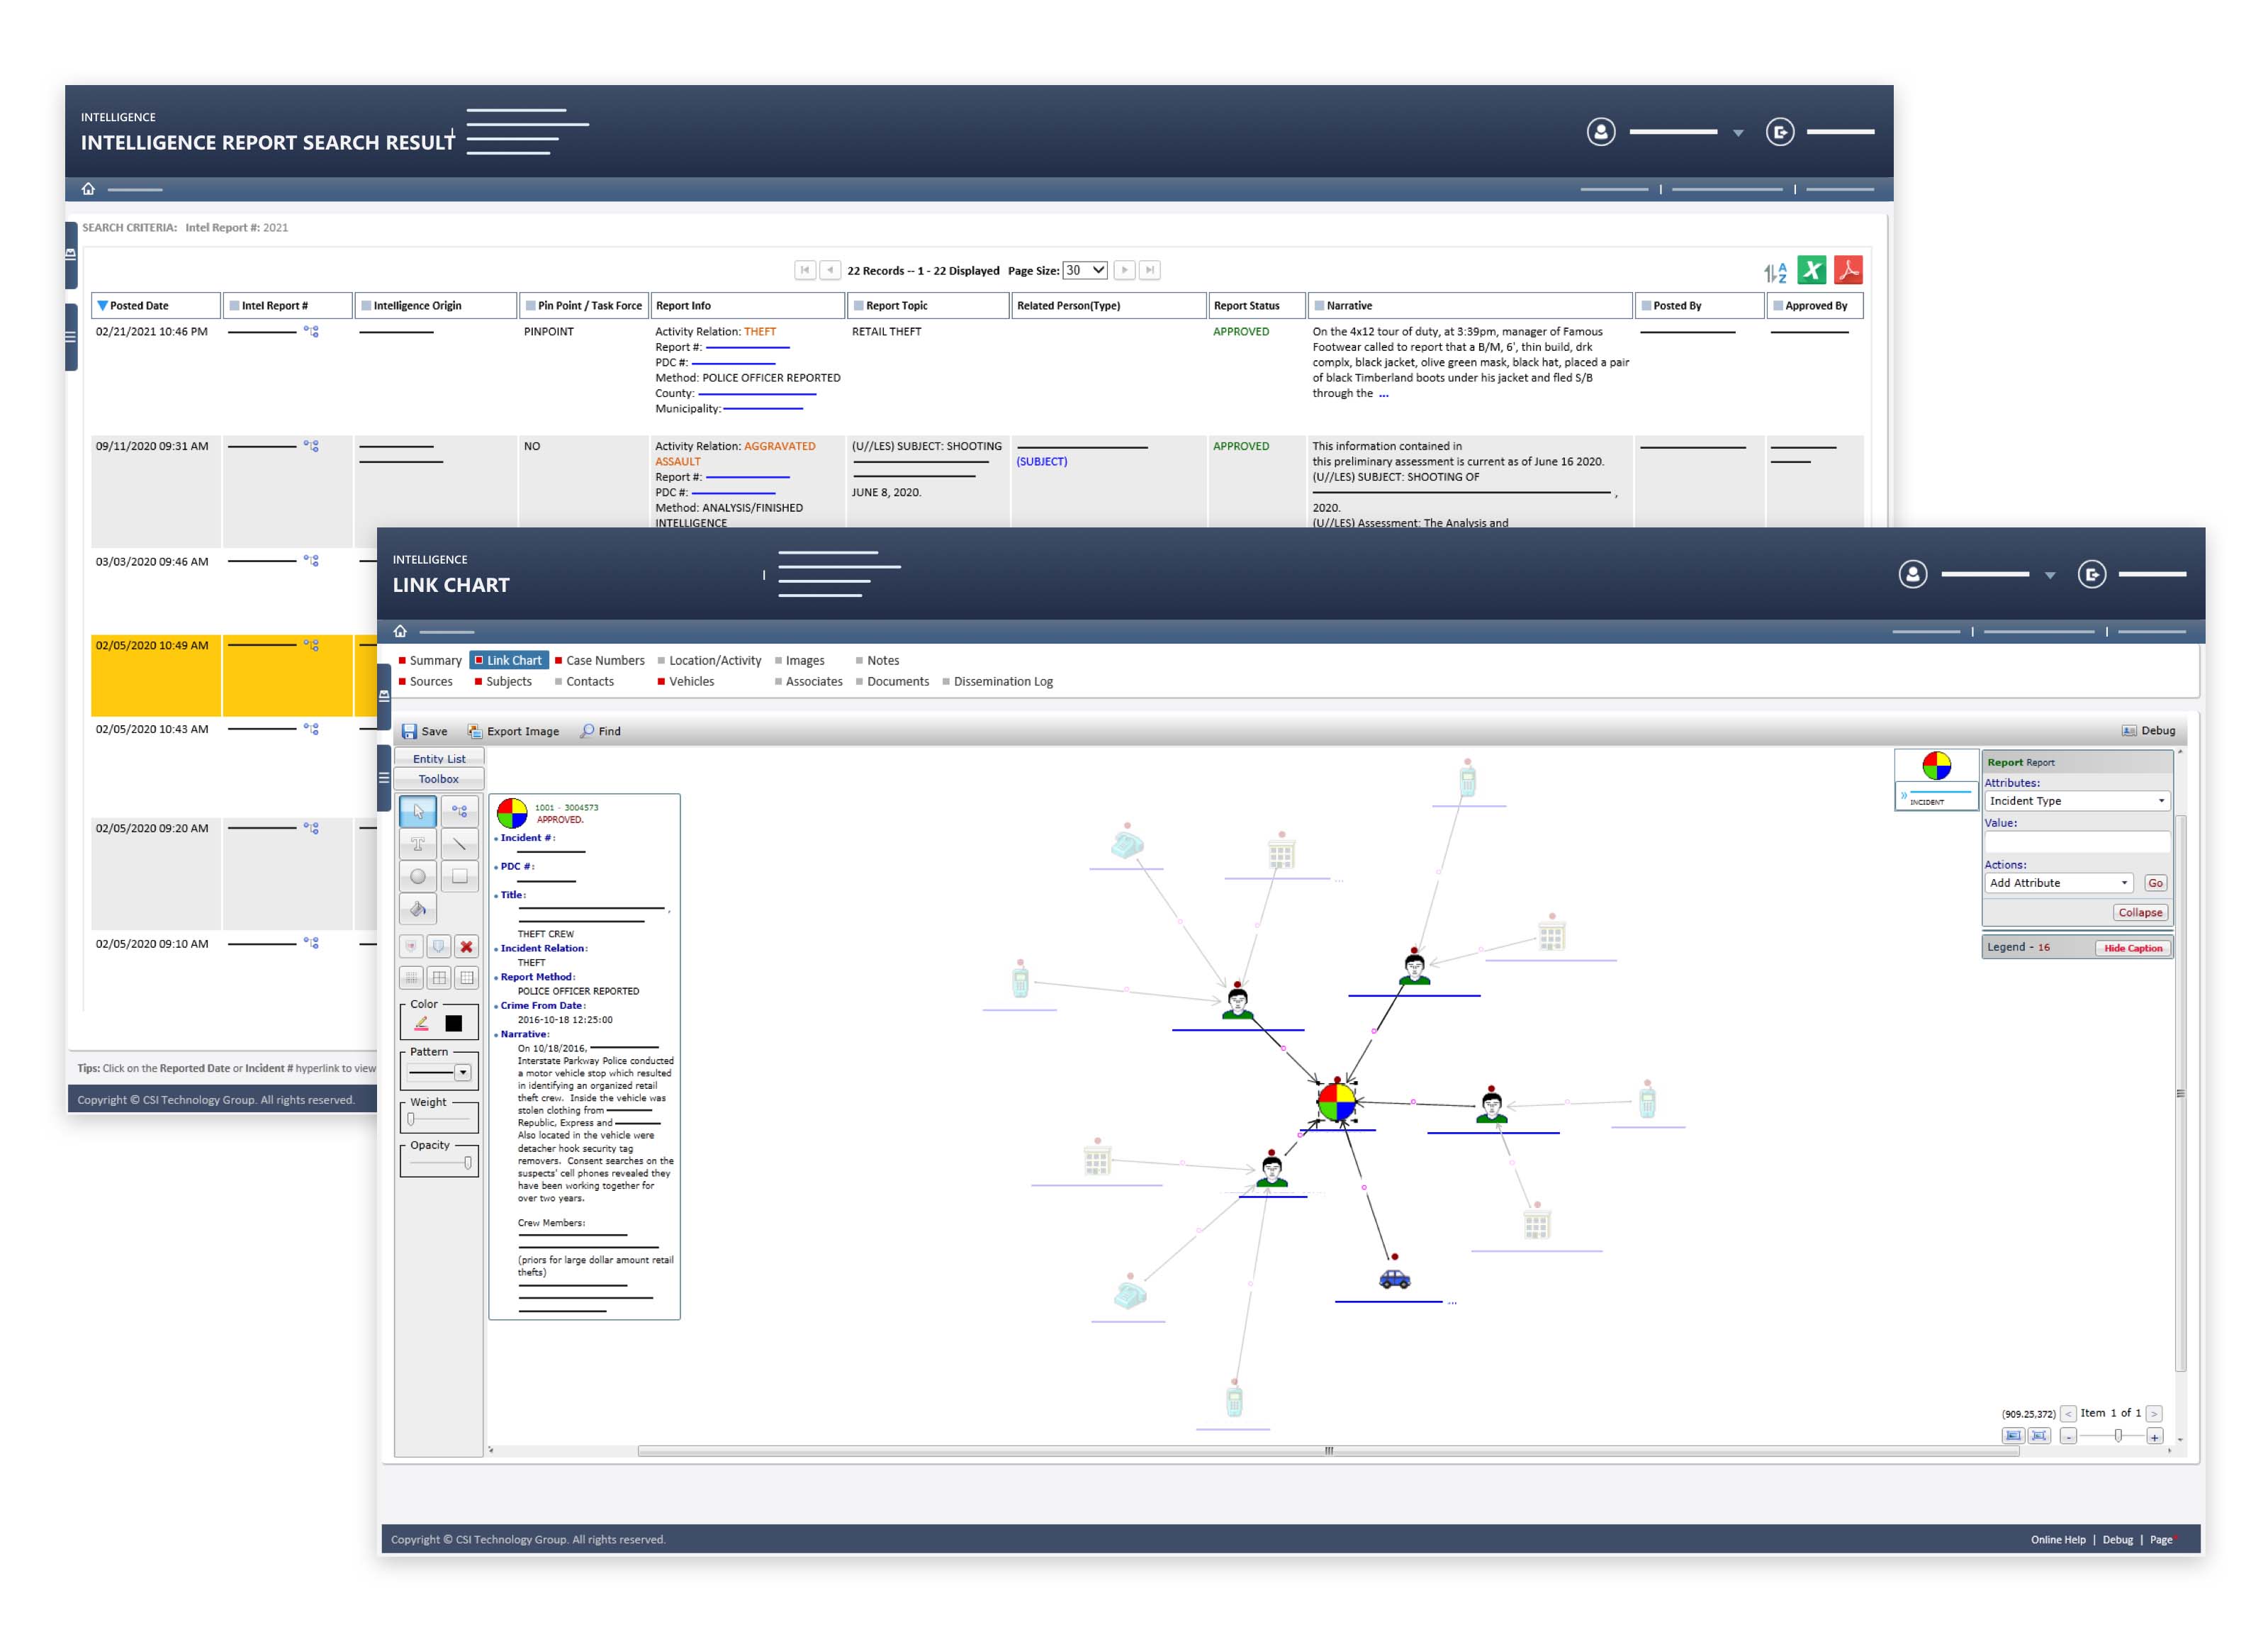
Create exportable visual link charts showing relationships between key objects. Simplify complexity, see context, and uncover hidden links or anomalies to provide insight for better decision-making.
- People
- Locations
- Vehicles
- Phones
- Establishments
- Criminal Organizations
Crime Mapping
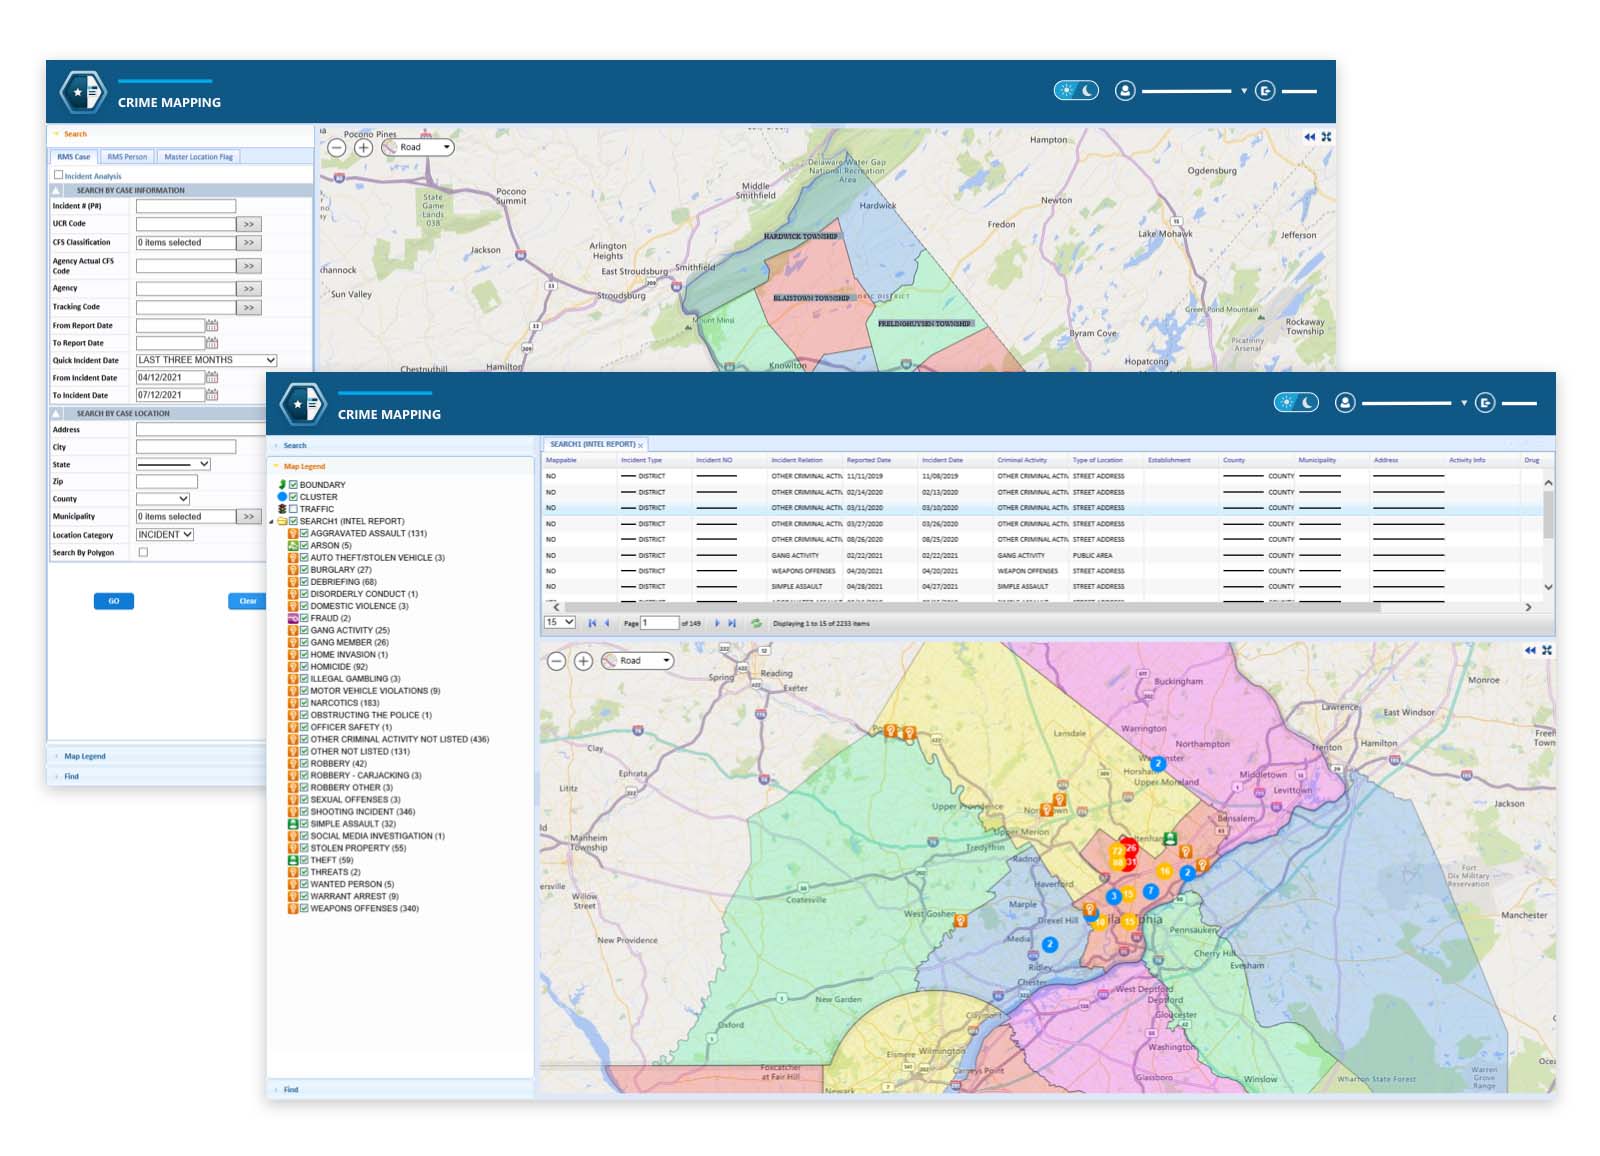
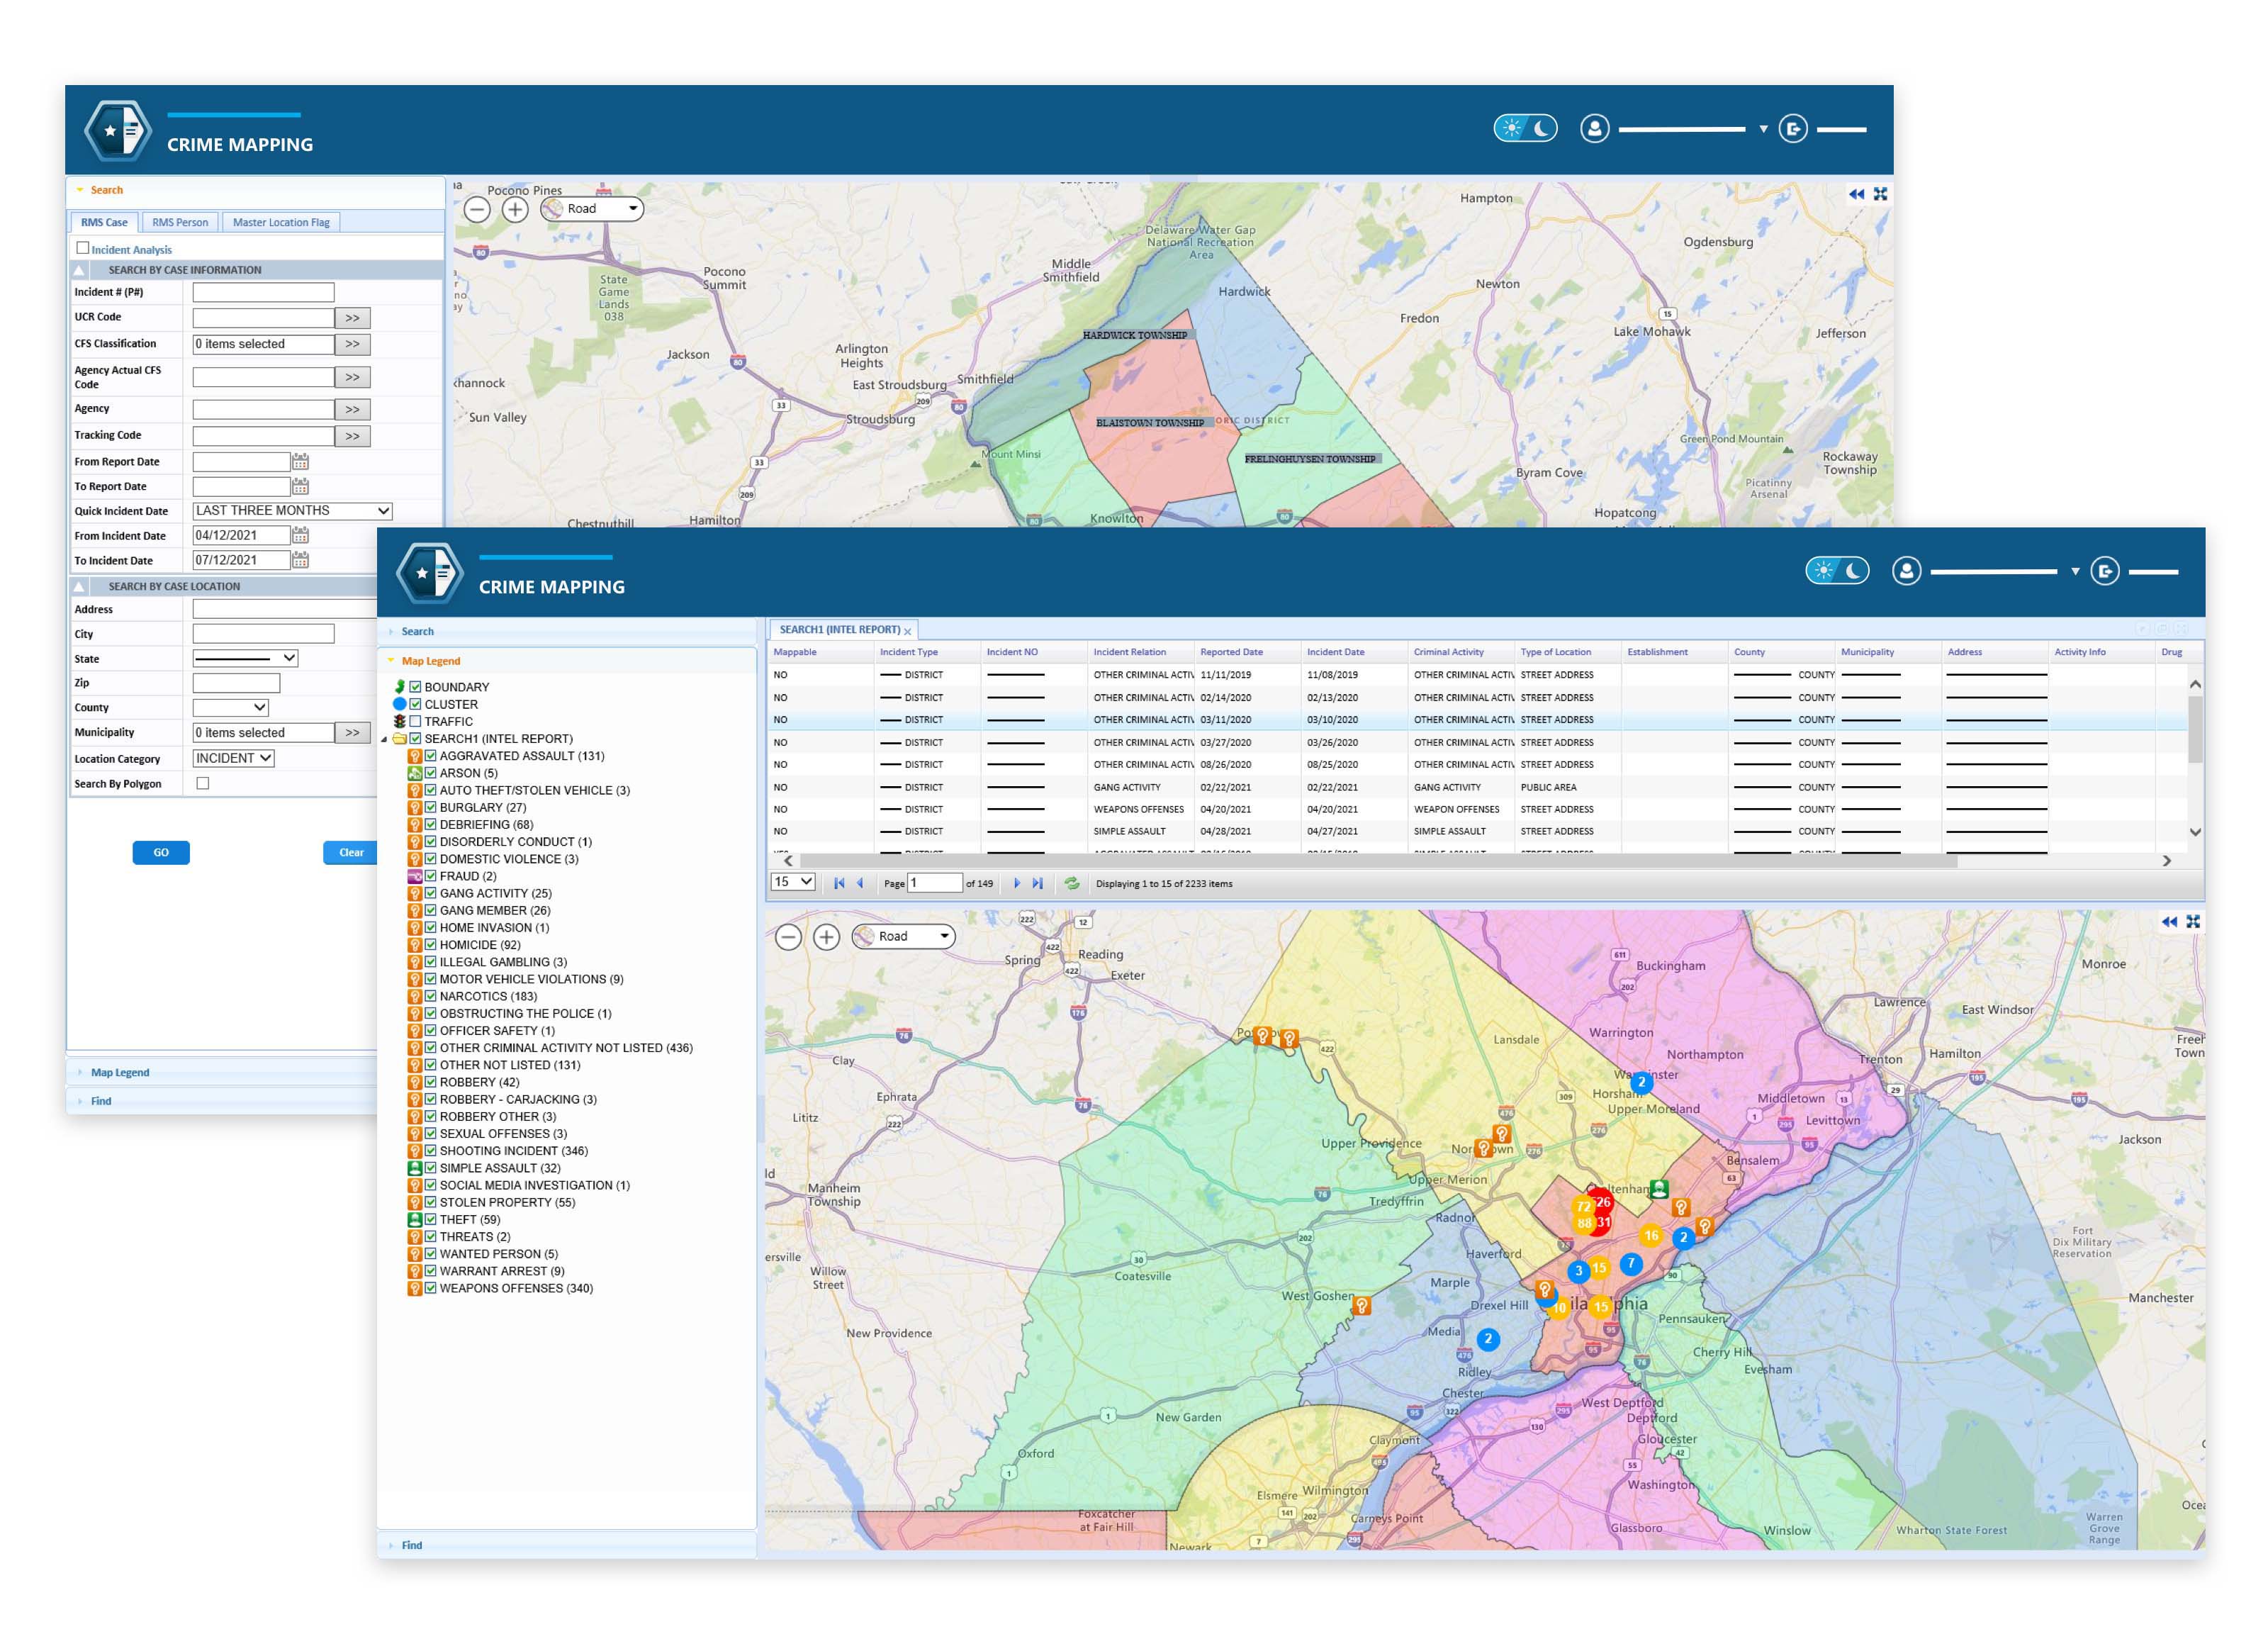
Visualize criminal activity patterns, identify crime hot spots, and deploy proactive policing efforts. Drill down on individual incidents and easily access any linked reports. Configurable search features ensure users find the needed data as quickly as possible.
- Multidimensional incident analysis
- Interactive crime mapping
- Hot spot and heat mapping
- Incident clustering
- Robust search configurations
- Polygon map search

Richard Norcross
Executive Vice President


Vincit Omnia Veritas (Truth Conquers All)


Jimmy Calderella
Account Management Team
Related Articles
 Event
CSI at the National Fusion Center Association Conference and Our Partnership with the New Hampshire Information and Analysis Center
 News
InfoShare® Fusion Center Software Suite: A Powerful Analytics Package
 Success Stories
Delaware County’s Unified Approach to Records Management and Prosecution Using InfoShare®
 Success Stories